
Data Sheet

Copyright © Terabee 2018
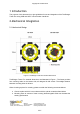
**Maximum current consumption with eight TeraRanger Evo sensors connected and looking at
long-range/low reflectivity targets or infinity in simultaneous mode. Drops significantly in sequential
mode and varies with target reflectivity and distance.
* Standby values (The sensor is not actively emitting light).
Stresses above the absolute maximum ratings may cause permanent damage to the device.
Exposure to maximum rating conditions for extended periods may affect product reliability.
3 USB interface
3.1 Graphical User Interface
A free graphical user interface is available for Windows, providing an easy way to visualize
the data from TeraRanger Tower Evo. This is useful for demonstration, testing purposes and
setting some of the basic parameters of the sensors, including operating and update rate
modes. It also provides a way to easily upgrade the firmware running on the device, should it
be required.
Please note that the same GUI is used for both TeraRanger Tower Evo and Hub Evo
products. The GUI is available for download from the TeraRanger Tower Evo page
(Downloads section) of the Terabee website. Please ensure you are using GUI version 1.0.3
or later.
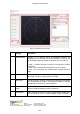
3.1.1
Basic Operation
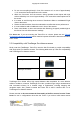
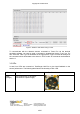
Connect the TeraRanger Tower Evo to a USB port on your computer and to a suitable power
supply. Select File > Connect. You should immediately see distance readings of TeraRanger
Evo sensors displayed on the main chart. See example in Figure 2. The following table
summarizes functionality of the graphical user interface.
Terabee Website:
90 Rue Henri Fabre Technical support:
01630, Saint-Genis-Pouilly Commercial:
www.teraranger.com
support@teraranger.com
teraranger@terabee.com
6/27