
User manual
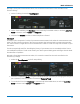

Math and Measure
Although a Track plots measurement values, it is created as a Math function and controlled on the
Function dialogs.
1. On the Fn dialog, choose the Track Operator.
2. On theTrack subdialog, use Find Scale to automatically find suitable values, or uncheck Auto Find
Scale and enter a custom Center and Height/div.
3. Choose a line Connect function of either Interpolate or Extend.
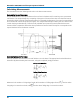
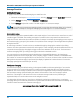
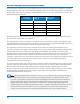
Plot Trend
A Trend is a plot composed of a series of parameter measurements in the order the measurements were
taken. The vertical units are those of the source parameter, the horizontal unit is measurement number.
The Trend contains a single value for each measurement. Think of Trend as a strip chart recorder for your
instrument.
Trends are especially useful for visualizing the history of a parameter over an extended period of time or
over multiple acquisitions. Trend can be used if your data is spaced widely apart and longer than the dead-
time between acquisitions.
Although a Trend plots measurement values, it is created as a Math function and controlled on the
Function (Fn) dialogs.
1. Select the Trend Operator on the Fn setup dialog.
2. Choose a computation Mode of All (plots multiple points per acquisition) or Average (plots one point
per acquisition). Enter the number of measured Values to Trend.
3. To rescale the Trend, use Find Scale to automatically find suitable values, or uncheck Auto Find
Scale and enter custom Center and Height/div values.
65