
User manual

WaveSurfer 3000/3000z Oscilloscopes Operator's Manual
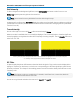
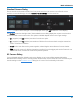
Gating Measurements
By using gates, you can narrow the span of the waveform on which to perform tests and measurements,
allowing you to focus on the area of greatest interest. For example, if you "gate" five rising edges of the
waveform, rise time calculations are performed only on the five pulses bounded by the gate posts.
The default starting positions of the gate posts are 0 div and 10 div, which coincide with the left and right
ends of the grid. Therefore, the gate initially encloses the entire waveform.
The quickest way to set a gate is to drag the gate posts from the far left and right of the grid to the desired
positions. You can refine this setting down to hundredths of a division by using the Gate Start and Stop
fields. All parameters share the same gate.
Touch the Default button to return gates to the width of the trace.
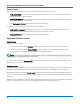
Plotting Measurements
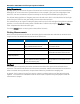
Both Track and Trend are tools that can be used to plot measurement data and observe variations with
respect to time. The table below summarizes their differences.
Track Trend
Represents Parameter value vs. time Parameter value vs. event
Cumulative Non-cumulative (resets after every acquis-
ition), unlimited number of events
Cumulative over several acquisitions up
to one million events
Time correlates to other data Yes No
Monitors Frequency domain Yes No, points are not evenly spaced in time
and therefore cannot be used for an FFT
Monitors parameters over
multiple acquisitions
No, resets after every acquisition Yes
Preserves all measurement
data
Yes (although maximum time period that
can be captured is limited by acquisition
memory and sampling rate)
No, data can be missed during time oscil-
loscope takes to re-arm between acquis-
itions
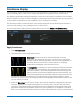
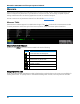
Plot Track
A Track is a plot composed of parameter measurements that is time synchronous with the source
waveform. The vertical units are those of the source parameter and the horizontal units are seconds. In
order to maintain time synchronism, the parameter values are posted at the sampling rate.
In general, Track is the tool to use if you want to capture a continuous stream of data spaced closely
together. Track values are redundant in that the same value is repeated every sample period until the
measurement changes.
64