
User manual

Display
Persistence Display
The Persistence feature retains waveform traces on the display for a set amount of time before allowing
them to gradually "decay," similar to the analog-style display of old, phosphor screen oscilloscopes.
The display is generated by repeated sampling of events over time and the accumulation of the sampled
data into "persistence maps". Statistical integrity is preserved because the duration (decay) is proportional
to the persistence population for each amplitude or time combination in the data.
The different persistence modes show the most frequent signal path in three-dimensional intensities of
the same color (Analog), or in a graded spectrum of colors (Color).
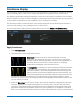
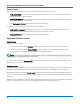
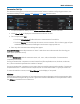
Access the Persistence dialog from the Display dialog or by choosing Display > Persistence Setup.
Apply Persistence
1. Check Persistence On.
2. Use the buttons to select a persistence mode:
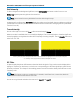
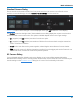
Color Mode persistence works on the same principle as Analog
persistence, but instead uses the entire color spectrum to map signal
intensity: violet for minimum population, red for maximum population. In
this mode, all traces use all colors, which is helpful for comparing
amplitudes by seeking like colors among the traces.
In Analog Mode, as a persistence data map develops, different intensities
of the same color are assigned to the range between a minimum and a
maximum population. The maximum population automatically gets the
highest intensity, the minimum population gets the lowest intensity, and
intermediate populations get intensities in between these extremes. The
information in the lower populations (for example, down at the noise level) could be of greater
interest to you than the rest. The Analog persistence view highlights the distribution of data so that
you can examine it in detail.
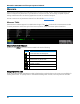
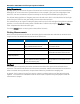
3. Select the Saturation level as a percentage of the maximum population. All populations above the
saturation population are assigned the highest color intensity: that is, they are saturated. At the
same time, all populations below the saturation level are assigned the remaining intensities. Data
populations are dynamically updated as data from new acquisitions is accumulated. A saturation
level of 100% spreads the intensity variation across the entire distribution; at lower saturation levels
57