
User manual

WaveSurfer 3000/3000z Oscilloscopes Operator's Manual
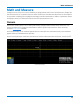
Grid Intensity
To dim or brighten the background grid lines, touch Grid Intensity and enter a value from 0 to 100.
Grid on top superimposes the grid over the waveform.
Note: Some waveforms may be hidden from view with the grid on top.
On WaveSurfer oscilloscopes, Axis labels display the values associated with the top and bottom grid lines
(calculated from Volts/div) and the time associated with the extreme left and right grid lines (calculated
from the Time/div).
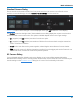
Trace Intensity
Choose a line style for traces: solid Line or disconnected sample Points.
When more data is available than can actually be displayed, Trace Intensity helps to visualize significant
events by applying an algorithm that dims less frequently occurring samples. Touch Intensity and enter a
value from 0 to 100.
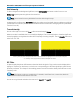
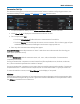
Intensity 40% (left) dims samples that occur ≤ 40% of the time to highlight the more frequent samples,
vs. intensity 100% (right) which shows all samples the same.
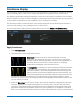
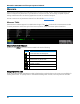
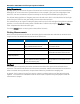
XY Plots
XY plots display the phase shift between otherwise identical signals. They can be used to display either
voltage or frequency on both axes, each axis now corresponding to a different signal input, rather than a
different parameter. The shape of the resulting pattern reveals information about phase difference and
frequency ratio.
Note: The inputs can be any combination of channels, math functions, or memories, but both
sources must have the same X-axis scale.
Choose an XY grid mode and select the sources for Input X and Input Y.
56