PROTOCOL SOLUTIONS GROUP 3385 SCOTT BLVD SANTA CLARA, CA 95054 Teledyne LeCroy PETracer™ PCI Express ProtoSync Software User Manual For Software Version 7.
PETracer Software User Manual Document Disclaimer The information in this document has been carefully checked and is believed to be reliable. However, no responsibility can be assumed for inaccuracies that may not have been detected. Teledyne LeCroy reserves the right to revise the information in this document without notice or penalty.
PETracer Software User Manual TABLE OF CONTENTS Chapter 1 Overview . . . . . . . . . . . . . . . . . . . . . . . . . . . . . 1 1.1 Other Documents . . . . . . . . . . . . . . . . . . . . . . . . . . . . . . . . . . . . . . . . . . . . 1 Chapter 2 Installation . . . . . . . . . . . . . . . . . . . . . . . . . . . . 3 Chapter 3 Software Overview . . . . . . . . . . . . . . . . . . . . . 5 3.1 The PETracer Software . . . . . . . . . . . . . . . . . . . . . . . . . . . . . . . . . . . . . . . . 5 3.
PETracer Software User Manual AHCI . . . . . . . . . . . . . . . . . . . . . . . . . . . . . . . . . . . . . . . . . . . . . . . . . . . 36 ATA . . . . . . . . . . . . . . . . . . . . . . . . . . . . . . . . . . . . . . . . . . . . . . . . . . . . 36 Chapter 5 Searching CATC Traces . . . . . . . . . . . . . . . . 37 5.1 CATC Trace Search Overview. . . . . . . . . . . . . . . . . . . . . . . . . . . . . . . . . . 5.2 Go to Trigger . . . . . . . . . . . . . . . . . . . . . . . . . . . . . . . . . . . . .
PETracer Software User Manual Chapter 7 BitTracer Trace Files . . . . . . . . . . . . . . . . . . . 69 7.1 Overview . . . . . . . . . . . . . . . . . . . . . . . . . . . . . . . . . . . . . . . . . . . . . . . . . . 7.2 Views Available for Captured Data . . . . . . . . . . . . . . . . . . . . . . . . . . . . . . 7.3 De-Skewing Data. . . . . . . . . . . . . . . . . . . . . . . . . . . . . . . . . . . . . . . . . . . . 7.4 Data Display Formats . . . . . . . . . . . . . . . . . . . . . . . . . . . . . . . .
PETracer Software User Manual 8.14 TC to VC Mapping . . . . . . . . . . . . . . . . . . . . . . . . . . . . . . . . . . . . . . . . . 8.15 Timing and Bus Usage Calculations . . . . . . . . . . . . . . . . . . . . . . . . . . . 8.16 PCIe SSD Base Address Mapping . . . . . . . . . . . . . . . . . . . . . . . . . . . . NVMe PCIe SSD Device Configuration . . . . . . . . . . . . . . . . . . . . . . . PQI PCIe SSD Device Configuration . . . . . . . . . . . . . . . . . . . . . . . . . 8.
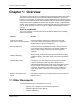
PETracer Software User Manual Chapter 1: Overview Chapter 1: Overview The Teledyne LeCroy PETracer™ PCI Express Protocol Analyzer Software is a powerful and intuitive expert software system embedding detailed knowledge of the protocol hierarchy and intricacies, as defined in the protocol specification. The Teledyne LeCroy PETracer™ PCI Express Protocol Analyzer Software utilizes a Windows-based graphical display that has been optimized for fast and easy navigation through a captured traffic session.
Chapter 1: Overview PETracer Software User Manual [page intentionally blank to preserve odd-even pagination] 2 Teledyne LeCroy
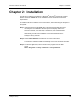
PETracer Software User Manual Chapter 2: Installation Chapter 2: Installation The PETracer software is installed on a Microsoft® Windows®-based host machine. Please consult the readme file on the installation CD for the latest host machine requirements. To install the PETracer software on the host machine, before attaching the Analyzer to the system: Step 1 Insert the CD into the CD ROM drive of the host machine that will control the Analyzer.
Chapter 2: Installation PETracer Software User Manual The PETracer program opens: Note: 4 The software may be used with or without the Analyzer attached to the system. When used without an Analyzer attached to the computer, the program functions as a CATC Trace Viewer to view and analyze captured traffic.
PETracer Software User Manual Chapter 3: Software Overview Chapter 3: Software Overview 3.1 The PETracer Software The PETracer™ software administers Analyzer platforms and handles all CATC Trace analysis and display. The core software is thus the same for all of Teledyne LeCroy's PCI Express products. The software runs on a Windows®-based host machine that is attached to the Analyzer via an Ethernet or USB 2.0 connection (USB 1.0 is also supported).
Chapter 3: Software Overview PETracer Software User Manual 3.2 Application Layout The PETracer application contains the following components: Title bar: The title bar is at the top of the application window and displays the CATC Trace file name or generation script name. Menu bar: The menu bar is located below the title bar, by default. The menu bar can be moved by clicking a blank area of the bar and then dragging the menu to a new position.
PETracer Software User Manual Zoom in display. Chapter 3: Software Overview Wraps display information. Zoom out display. Hide Training Sequence. Advanced Hiding Options Opens a dialog box that allows you to select items to hide from view. Hide SKIP and Update FC packets. Hide Unassociated Traffic Hides the lower-level transaction packets. Example: Link Transactions and Packets are considered "unassociated" when using Split Transaction Level view. Hide Upstream recording/traffic.
Chapter 3: Software Overview PETracer Software User Manual View NVM Transaction Level data. File Information Lists the conditions under which the recording was made. Bus Utilization Opens a window that graphically represents various information about the recording. Error Report Opens a window that lists all errors identified in the recording. Link Tracker Opens a window that displays symbol information per lane.
PETracer Software User Manual Chapter 3: Software Overview Toolbar Hide Buttons The PETracer application toolbar has five buttons related to show/hide of CATC Trace file contents. The buttons allow you to quickly adjust the display to your needs. Hide Training: Brings up a drop-down menu that lets you to hide all or a portion of the packets in the training portion of the CATC Trace.
Chapter 3: Software Overview PETracer Software User Manual Advanced Hiding Options: Brings up the Level Hiding pane of the Display Options window. Use this pane to tune the show/hide options within the CATC Trace display. Hide Unassociated Traffic: Hides the lower-level transaction packets. Example: Link Transactions and Packets are considered "unassociated" when using Split Transaction Level view.
PETracer Software User Manual Chapter 3: Software Overview 3.4 Using the Menus The PETracer application main display includes the following set of pull-down menus: File Menu New Generator Script Creates a new Traffic Generation file. Open Opens a file. Close Closes the current file. Save as Saves all or a specified range of packets to a uniquely named file. Convert Old Files Convert CATC Trace files made in previous versions of PETracer to the new format for PETracer version 5.0 and higher.
Chapter 3: Software Overview PETracer Software User Manual Setup Menu Display Options Allows you to customize display options such as field colors, field formats and level hiding. Report Menu Report Menu operations are only available when you are working with a CATC Trace file. File Information Displays information about the file contents and describes the conditions of the file’s recording (Recording Options, hardware information, and so on).
PETracer Software User Manual Chapter 3: Software Overview Search Menu Search Menu operations are only available when you are working with a CATC Trace file. Go to Trigger Repositions the display to show the first packet following the trigger event. Go to Selected Packet Repositions the display to a specific packet, Link or Split transaction of PCI Express protocol or NVME, PQI, AHCI protocol and ATA command transactions number.
Chapter 3: Software Overview PETracer Software User Manual View Menu Toolbars>> Displays available toolbars: Standard, Frequently Used, Analysis, and Transaction Level. Use Customize to display the Windows Customize window. Script Editor Displays the Script Editor (only appears if a .peg file is open). Status Bar Switches display of the Status Bar on or off. Zoom In Zoom in increases the size of the displayed elements. Zoom Out Zoom out decreases the size of the displayed elements.
PETracer Software User Manual Chapter 3: Software Overview Tools Menu TC to VC Mapping Allows Traffic Classes to be mapped to Virtual Channels for purposes of simplifying navigation (for example, Search > Go to > TLP Virtual Channel) and changing the way the CATC Trace is displayed (for example, in Split Transactions). Timing Calculations Starts the mode-less calculator dialog for calculating various timing and bandwidth parameters in the recording file.
Chapter 3: Software Overview PETracer Software User Manual 3.5 Tool Tips Tool tips provide details about fields within the CATC Trace. To see a tool tip, position your mouse pointer over a field within the CATC Trace. You can turn off this capability in the Display Options menu. 3.6 Keyboard Shortcuts Keystrokes Operation Ctrl + N New PETracer script Ctrl + O Open file Ctrl + P Print Ctrl + S Save file Ctrl + Home Jump to first packet Ctrl + End Jump to last packet Ctrl + G Go to packet .
PETracer Software User Manual Chapter 3: Software Overview 3.8 PETracer Files The PETracer software creates and uses different kinds of files: • • CATC Trace Files: Trace files optimized for protocol analysis. BitTracer Files: Trace files optimized for link and phy layer analysis. 3.9 Opening CATC Trace Files To open an existing CATC Trace file, click File > Open or .
Chapter 3: Software Overview PETracer Software User Manual 3.10 Saving CATC Trace Files Using the Save As Function When you record a CATC Trace file, the Analyzer software provides a pre-defined name to the CATC Trace file (data.pex or any other that you specified in the Recording Options). If you do consecutive recordings, each time the previous recording is overwritten.
PETracer Software User Manual Chapter 3: Software Overview 3.11 Exporting a CATC Trace File By default, PETracer saves CATC Trace files in the .pex format. However, you can export a CATC Trace to a file in any of the following other formats: • Text • Comma Separated Value (CSV) • Generator file format Exporting to Generator file format is a simple way to create a script file from your CATC Trace. Only PCI Express packets will be exported to a script.
Chapter 3: Software Overview PETracer Software User Manual 3.12 Printing Data Files To print all or part of the open CATC Trace: Step 1 Select File > Print from the menu or click the Printer button on the toolbar. The Print Packets dialog opens: Step 2 To select a range of packets, enter values in the From packet # and To packet # fields and click Print. Step 3 To print an entire file, leave the From and To fields empty and click Print.
PETracer Software User Manual Chapter 4: Reading CATC Traces Chapter 4: Reading CATC Traces 4.1 Viewing PCI Express CATC Traces PETracer™ displays traffic as labeled, color‐coded, and time‐stamped rows. Tool tips provide details about fields within the CATC Trace. Hold the mouse cursor over a field to see a tool tip. Additional information is available from pop‐up menus. For example, if you click the left mouse button on the first cell in a packet a menu appears with an option to view Raw 10b Codes. 4.
Chapter 4: Reading CATC Traces PETracer Software User Manual 4.3 Resizing Cells Data cells can be resized by pointing the mouse pointer on the edge of a data cell, depressing and holding the left mouse button, and then repositioning the mouse pointer while keeping the mouse button depressed. 4.4 Pop-up Menus The Analyzer software makes extensive use of pop‐up menus.
PETracer Software User Manual Chapter 4: Reading CATC Traces 4.5 View Data Block To view the raw bits that make up the data in a data field, left‐click a data field, then click or select View Data Block from the pop‐up menu to display the Data Block window. You can display data in Hexadecimal, ASCII, Decimal, or Binary formats. Bit Order is Most Significant Bit or Least Significant Bit. You can display data in Big Endian or Little Endian. Format lets you display data as BYTEs, WORDs, or DWORDs.
Chapter 4: Reading CATC Traces PETracer Software User Manual 4.6 Show Raw 10b Codes You can view the raw bits that make up the data field by left‐clicking the field and selecting View Data Block from the pop‐up menu. To view Raw 10b Codes: Step 1 Left-click the first cell in a packet. Step 2 Select Show Raw 10b Codes from the pop-up menu to display the Raw 10b Codes window. Step 3 To change the format of the data, use the options along the right side of the dialog.
PETracer Software User Manual Chapter 4: Reading CATC Traces 4.7 Show Header Fields You can view details about header fields by opening the Show Header Fields dialog box. Step 1 Click a header. A pop-up menu appears. Step 2 Select Show Header Fields. The following dialog box opens. Step 3 Use the Prev and Next buttons to navigate to other headers. Set Start Quick Timing Marker Sets the start packet for the Quick Timing marker. An S symbol is displayed at the packet.
Chapter 4: Reading CATC Traces PETracer Software User Manual Quick Timing provides immediate time deltas and bandwidth calculations. If the Start is placed on a packet that contains an Address and Endpoint, the bandwidth for that combination is displayed in the Status Bar below the trace data. Quick Timing Markers are special ""Start"" and ""End"" markers used to mark the boundaries of the calculations. The results are shown in a special Quick Timing Bar at the bottom of the TraceView.
PETracer Software User Manual Chapter 4: Reading CATC Traces The right‐click pop‐up menu from Packet cell is: Packet Header R-> Cell Popup Menu The Packet Header R‐> cell has a pop‐up menu with the Swap Upstream/Downstream command, which changes the directionality of the packets in the CATC Trace.
Chapter 4: Reading CATC Traces PETracer Software User Manual Packet Header G1 Cell Popup Menu The Packet Header G1 cell has a pop‐up menu with the Show Header Fields command (see “Show Header Fields” on page 25), which exposes a detailed view of the selected Header field. 4.8 Set Marker A marker is a unique label for a packet that allows you to go to that packet and also serves as a comment string for a specific packet. When you select a marker, the identified packet appears at the top of the screen.
PETracer Software User Manual Chapter 4: Reading CATC Traces next page), enter a unique identifier for the packet in the Comment field. Later, you can go directly to this packet using the Go To Marker operation in the Search Menu.
Chapter 4: Reading CATC Traces PETracer Software User Manual 4.9 Edit or Clear Marker To change a markers identifier, or clear (delete) the marker: Step 1 Right-click the Packet field of the desired packet to display a pop-up menu. Step 2 Choose Edit Marker and enter a new identifier into the Edit Marker for Packer # pop-up, or choose Clear Marker. When you choose Clear Marker, the marker is removed and the red line disappears. 4.
PETracer Software User Manual Chapter 4: Reading CATC Traces Figure 4.1: Compressed CATC Trace Step 2 Click on the toolbar to return to the normal CATC Trace View, or Select View > Trace Views > CATC Trace. 4.11 Spreadsheet View You can view the CATC Trace as a spreadsheet in color or black and white. Click Teledyne LeCroy on the toolbar to display the Spreadsheet View.
Chapter 4: Reading CATC Traces Click PETracer Software User Manual on the toolbar to display the Spreadsheet View B/W. Columns To add a column, right‐click a column header, select Add Column, and then select the column name. To delete a column, right‐click a column header and then select Remove Column. To reposition a column, drag the column header to the new position. To resize columns, select the column divider and drag the divider to the right or left.
PETracer Software User Manual Chapter 4: Reading CATC Traces Figure 4.2: NVMe Transaction Level Detail View and Spreadsheet View In the Spreadsheet View, double‐click a packet, transaction, or transfer, or select a field and then click figure on next page). on the toolbar, to display the Detail View (see To put a Detail View header in the Spreadsheet View, drag the header to a column divider in the Spreadsheet View.
Chapter 4: Reading CATC Traces PETracer Software User Manual 4.12 Decoding Traffic The PETracer software has three decode levels: Packet Packet level decode sets. includes all TLP packets, DLLP packets, and all ordered Link Link level decode is composed of TLP packets matched with a corresponding ACK or NAK coming from the opposite direction.
PETracer Software User Manual Chapter 4: Reading CATC Traces Split Split level decode is composed of two Link transactions, the Request TLP and the Completion TLP from the other direction. NVM NVM level decode displays NVMe transactions. PETracer decodes the storage commands starting from lower Transaction Layer decodes. In the case of NVMe, it will decode first the Packet Level, then the Link Transaction level, then the Split Transaction Level and finally the NVME decode level.
Chapter 4: Reading CATC Traces PETracer Software User Manual AHCI AHCI level decode displays AHCI transactions. PETracer decodes the storage commands starting from lower Transaction Layer decodes. In the case of AHCI, it will decode first the Packet Level, then the Link Transaction level, then the Split Transaction Level and finally the AHCI decode level.
PETracer Software User Manual Chapter 5: Searching CATC Traces Chapter 5: Searching CATC Traces This chapter describes how to search for CATC Trace events. 5.1 CATC Trace Search Overview Several search commands let you navigate a CATC Trace view to search for key events, such as errors and triggers. To view the search options, click Search in the Menu bar. 5.2 Go to Trigger To position a trigger packet at the top of the screen: • Select Search > Go to Trigger. 5.
Chapter 5: Searching CATC Traces PETracer Software User Manual Step 3 Click OK. 5.4 Go to Time To position a specific time at the top of the screen: Step 1 Select Go to Time from the Search menu. A pop-up menu prompts you for the time in Seconds or Clocks. Step 2 Enter the time and format (seconds or clocks). Step 3 Click Go. 5.5 Go to Marker Use this operation to go directly to a specific packet that has been marked with a unique marker by the Set Marker operation.
PETracer Software User Manual Chapter 5: Searching CATC Traces The packet you want appears at the top of the screen. Marked packets have a red bar on the left edge. Markers This section explains the features of Markers. A marker is an entity that flags a physical or logical item of interest within a trace file. A marker contains one or more attachments. You can add a marker to a trace file or unmark a trace file by removing the marker.
Chapter 5: Searching CATC Traces PETracer Software User Manual You can add attachments to markers. Right‐click on any cell of a packet and select Set Marker from the menu as shown below. select an option. The Create Marker dialog displays.
PETracer Software User Manual Chapter 5: Searching CATC Traces As shown above you can: Add icon. Click on this icon to add any file. See “Adding an Attachment” on page 41. Record icon. Click on this icon to record audio. See “Recording an Audio File” on page 42. Export icon. Click on this icon to export an attachment. Delete icon. Click on this icon to delete an attachment New URL icon. Click on this icon to add any URL.
Chapter 5: Searching CATC Traces PETracer Software User Manual Recording an Audio File The audio quality supports voice attachment and is not designed for high‐quality audio Playback of audio content is not limited and depends on the formats supported by the installed playback engine. Click the record icon and speak into the microphone to record an audio file. Note: This functionality is disabled if a microphone is not installed.
PETracer Software User Manual Chapter 5: Searching CATC Traces Attachment Types and Visualization The markers are represented graphically by a yellow triangle at the top right of the marked item and a red vertical bar at the left‐most cell of a packet as shown below. Marked A marker may comprise any number of attachments of any types. Embedded Attachments to a Marker Embedded files are attached to the item marked and transported with the trace.
Chapter 5: Searching CATC Traces PETracer Software User Manual Viewing Attachments of a Marker If you hover over the marked cell (yellow triangle at the top right of the marked item), refer to “Attachment Types and Visualization” on page 43, a window pops up displaying the contents of the marked cell as shown below. To view an attachment you can click on any of the icons in the attachment bar and or you can double‐click on the icon itself to open the attachment.
PETracer Software User Manual Chapter 5: Searching CATC Traces If there are attachments, the status bar is hidden. You can move the cursor to an attachment icon in the list view and a preview of the attachment starts. Audio Audio snippets that are recorded and attached to certain point of interest in a trace can be played. The basic Play, Start, Stop, Pause buttons are displayed to listen to the audio file.
Chapter 5: Searching CATC Traces PETracer Software User Manual Video Video clips that are recorded and attached to certain point of interest in a trace can be played. The video is embedded in the tooltip with simple playback controls. File Attachment You can attach any kind of file, including images, PDFs, documents, media files, etc. URL Link You can specify a URL that links to a web page (i.e., YouTube), a network location, or a local file‐system location.
PETracer Software User Manual Chapter 5: Searching CATC Traces YouTube Video YouTube’s video player is embedded for YouTube Video playback. Images The image is embedded in the trace.
Chapter 5: Searching CATC Traces PETracer Software User Manual Other Attachments Click the Open button to open the attachment file with the system’s default application for that file type. Edit Marker To edit a marker, right‐click on the marked item and select Edit marker from the menu. The Edit Marker dialog displays (see following figure). This Edit Marker window can be used to edit one marker at a time. You can do the following in the Edit Marker dialog: • • • • • • • 48 Edit text attachment.
PETracer Software User Manual Chapter 5: Searching CATC Traces EDIT Marker for Packet Dialog All Markers Window Select Search > Go to Marker > All Markers or press Ctrl + M to display a list of all the markers in the file (see figure on next page). The window uses a tree structure to show packets, fields and markers.
Chapter 5: Searching CATC Traces PETracer Software User Manual Edit Marker Dialog You can filter to show or hide text, image, audio, video, URL, YouTube videos and other files.
PETracer Software User Manual Chapter 5: Searching CATC Traces 5.6 CATC Walk Playlist This feature allows users to configure sequences of attachments into playlists. Any arbitrary order of attachments are allowed, and there are no limits on the number of playlists supported. This feature can be used for collaborating among developers as well for training, support and marketing purposes.
Chapter 5: Searching CATC Traces PETracer Software User Manual You can drag and drop and item or attachment from the Marker panel into the Playlist panel and build a story. Give a description of the playlist in the Description field and you can give a name to the playlist in the Name field. You can add a new playlist by clicking on the green plus sign (+) on the right top corner of the Playlist panel, or delete a playlist by clicking the red (x) button.
PETracer Software User Manual Chapter 5: Searching CATC Traces The attachment item starts to play in the playback window as shown below. The playback window is resizable. The close button at the top right corner and the size grip for resizing at the bottom right corner will hide automatically when moving the cursor out of the window. Users can provide commentary to a captured trace, converting it into a script or a story and can transfer this meta‐information to others. Playlist Playback Controls.
Chapter 5: Searching CATC Traces PETracer Software User Manual Playback Window 5.7 Go To Menu The Go To menu in the Search menu provides a quick way to search for a packet based on a simple condition. You can search for the following types of events: • • • • • • • • • • • • • • TLP Type DLLP Type Ordered Set Link Event Traffic Class DLLP Virtual Channel TLP Virtual Channel Direction Speed Link Width Requester ID Completer ID Data Lengths Errors 5.
PETracer Software User Manual Chapter 5: Searching CATC Traces To verify the direction of a search look at the lower right corner of the screen. Search: Bwd or Search: Fwd should appear. If a direction is not indicated, it means that the status bar is turned off. To turn on the Status bar, select from the menu View > Status Bar. Keyboard shortcuts can also be used to control search direction: • Alt-f means Search Forward. • Alt-b means Search Backward. 5.
Chapter 5: Searching CATC Traces PETracer Software User Manual Step 2 Open Find by selecting Search > Find from the menu or clicking . Step 3 From the Search For menu, select a display level such as Packets. To search multiple levels, finish steps 3 to 9, and then repeat 3 to 9 for each additional display level. Step 4 From the Event Groups menu, select an Event Group. The menu in the far right of the dialog box is context sensitive and changes to reflect the options for that group.
PETracer Software User Manual Chapter 5: Searching CATC Traces The options Union, Intersection, and Exclusion let you set conditions on your searches: • Union: To search for any of the selected criteria. Example: “Find packets with ANY of the following characteristics …” • Intersection: To search for all of the selected criteria. Example: “Find packets with ALL of the following characteristics …” • Exclude: To exclude items from a search.
Chapter 5: Searching CATC Traces PETracer Software User Manual The Event Groups for Link Transactions and Split Transactions are: • • • • • • • • TLP Type Traffic Class Virtual Channel Direction RequesterID CompleterID Status Tag The Event Groups for AHCI Transactions are: • • • • • • • AHCI Register ID AHCI Port Number AHCI Slot Number AHCI Port Multiplier Port AHCI Raw Address AHCI Direction AHCI Errors TS1 and TS2 Event Groups Selecting TS1 Data or TS2 Data options allows further definition of the
PETracer Software User Manual Chapter 5: Searching CATC Traces Select parameters from the links to use and enter the mask and match values (see following figure). Select parameters from the links to use and enter the mask and match values. Search for the Next Packet Type Use Find Next or click criteria.
Chapter 5: Searching CATC Traces 60 PETracer Software User Manual Teledyne LeCroy
PETracer Software User Manual Chapter 6: Display Options Chapter 6: Display Options 6.1 Setting Display Options Display Options allow you to customize the colors and formats of displayed traffic. To open the Display Options dialog at the General tab, Select Setup > Display Options from the menu or click the Display Options button on the toolbar.
Chapter 6: Display Options PETracer Software User Manual 6.2 Specifying General Display Options The Display Options General tab allows you to specify: Zoom Level: Defines the size of packet fields in the packet view. Zoom level is adjustable as 10, 20, 40, 60, 80, 100, 120, 140, 160, 180 and 200 percent. Enable Tool tips: Allows information to be displayed on a packet by resting your mouse pointer over it. Wrap: Allows packets, Link Transactions, and Split Transactions to wrap within the display.
PETracer Software User Manual Chapter 6: Display Options 6.3 Color, Format, and Hiding Options The Color/Format/Hiding tab allows you to customize the colors and formats associated with each field in the CATC Trace and to selectively hide fields or packets. You access these display options by selecting Setup > Display Options > Color/Format/Hiding tab. The Color/Format/Hiding property page lets you set how fields display in a CATC Trace.
Chapter 6: Display Options PETracer Software User Manual Step 3 Under the Group and Colors column, click the plus symbol (+) next to the group you want to reformat. The group expands to show the individual fields within the group. Each field has a color, as shown below: Step 4 Click the colored cell that you want to change. A color palette appears. Step 5 Click a color in the palette, then click Apply or OK.
PETracer Software User Manual Chapter 6: Display Options Changing Field Formats The Field Formats tab allows you to define the way various numeric fields are shown in the packet display. You can select Hexadecimal, Decimal, Binary, or ASCII for certain fields or groups of fields. To change a field's format, click the plus sign (+) next to a field in the list. This causes the selected item to expand so you can see its constituent sub-fields.
Chapter 6: Display Options PETracer Software User Manual Step 4 Specify the bit order in the displayed fields by checking/unchecking the MSB > LSB checkboxes. Step 5 Click Apply or OK. Hiding Fields To hide a field: Step 1 Under the Group and Colors column, click the plus symbol (+) next to the group that has the field(s) you want to hide. The group expands to show the individual fields within the group (as shown above). Step 2 Click the checkbox in the row representing the field that you want to hide.
PETracer Software User Manual Chapter 6: Display Options To hide a level: Step 1 Select an Event Group. Step 2 Select whether to Hide or Show selected items. Step 3 Select Upstream, Downstream, or Any Direction. Step 4 (optional) Select Compact EIEOS packets. Step 5 Click OK.
Chapter 6: Display Options PETracer Software User Manual 6.4 Load a Previously Saved Display Options File If you have previously saved Display Options, you can load them by opening the Display Options dialog and clicking the Load button. A dialog box opens to let you load a previously saved display options file. Step 1 Click Load to use a previously defined display options file. Step 2 When you see the Open File pop-up window, enter the name of the file you want to load and click Open.
PETracer Software User Manual Chapter 7: BitTracer Trace Files Chapter 7: BitTracer Trace Files 7.1 Overview Note: BitTracer is an optional feature. BitTracer displays bi-directional link traffic in raw format. The BitTracer mode captures and displays traffic before lane-to-lane de-skew operations and before descrambling of 10b bytes. The BitTracer mode includes support for multiple logical links (bifurcations) on a single physical link.
Chapter 7: BitTracer Trace Files PETracer Software User Manual 7.3 De-Skewing Data By default, BitTracer recordings display captured data in a raw, time-skewed format, across all lanes in both directions. Individual bytes are as they were captured on the recorded link, before the receiver device on the link (or the receiver logic on the PETracer analyzer) has performed lane-to-lane de-skew operations.
PETracer Software User Manual Chapter 7: BitTracer Trace Files 7.5 Color-Coding of BitTracer Contents To increase visual understanding of BitTracer displays, different symbol types have color-coding: • • • • • • • Presence or non-presence of a lane’s byte-lock Idle data characters (D0.0) K codes Invalid 10b symbols Signal presence Background of the Markers Bar (see “Markers Bar” on page 72) (color coded according to traffic speed).
Chapter 7: BitTracer Trace Files PETracer Software User Manual 7.7 Timing Measurements Bar BitTracer mode provides timing measurements on captured data: • • • Measurements from the Trigger position relative to user-selected X and Y markers X-Y measurements Measurements between user-defined markers Markers Bar The Trigger marker trigger condition.
PETracer Software User Manual Chapter 7: BitTracer Trace Files You can also display the Markers window, which lists all markers and their locations, including a hyperlink for each. Timing measurements between all combinations of X, Y, U, and Trigger cursors are in the Timing window.
Chapter 7: BitTracer Trace Files PETracer Software User Manual 7.8 Errors Bar BitTracer mode provides a summary of 10b errors (invalid symbols) and disparity errors in the Errors window. The window shows the total error count and errors per-lane for each error type. Hyperlinks allow jumps to selected errors. BitTracer mode also highlights errors: • • 74 Invalid symbols have a black background. Bytes with incorrect running disparity have red borders.
PETracer Software User Manual Chapter 7: BitTracer Trace Files 7.9 Symbols Bar The Symbol window provides a summary of the different symbol types captured, by quantity and direction, and includes hyperlinks for jumps to selected symbols. Expanding the + sign at the left of each symbol provides a summary of symbols by lane. 7.10 Events Bar The Events report window summarizes Link Up, Link Down, and Speed Switch events for Upstream and Downstream. Note: The table entries are hyperlinks.
Chapter 7: BitTracer Trace Files PETracer Software User Manual 7.11 Packets Bar The Packets report window summarizes packet types detected in the file. To obtain packet types, you must perform a post-capture “Analyze” step. After capture, when you open the Packets Bar for the first time, items can display the command “Analyze”. To start the analysis, click the word Analyze. After analysis finishes, the results are saved with the file. Therefore, you do not need to click Analyze the next time.
PETracer Software User Manual Chapter 7: BitTracer Trace Files 7.12 Decoding Bar If you select them in the data view, or search or jump locates a feature, BitTracer mode displays ordered sets and packets in the Decoding window: • • Logical view is identical to CATC Trace format. Specification view provides a more elementary display. The Specification view includes an option to display data in hex or binary format.
Chapter 7: BitTracer Trace Files PETracer Software User Manual 7.13 Search To search, use the Search toolbar. Clicking the Search icon displays the Search window. You can copy data shown in the BitTracer display across a lane (horizontally) or across multiple lanes (vertically), and then paste it into the Search Pattern window. The Search Pattern window stores previous search values, which you can recall by selecting the Search Pattern drop-down button.
PETracer Software User Manual Chapter 7: BitTracer Trace Files 7.14 Link Configuration Use the toolbar icon or right-click in the data views to display the Link Configuration dialog. This dialog allows you to associate logical lanes with physical lanes, thereby providing support for lane bifurcation (multiple logical links on the same physical link).
Chapter 7: BitTracer Trace Files PETracer Software User Manual Note: This dialog applies to one direction at a time (upstream or downstream). Left-click in the direction in the data display to edit the configuration for that direction. As you perform operations that affect display configurations, the application records them. To undo or redo operations, use the Undo and Re-do icons on the toolbar.
PETracer Software User Manual Chapter 7: BitTracer Trace Files 7.15 Export of BitTracer Capture to CATC Trace Format You can export BitTracer captures to standard CATC Trace file formats, selecting the Export option from the File menu. Note: You should use the Auto De-skew feature before using the export feature. The exported CATC Trace keeps association information with the original BitTracer file. Such traces scroll synchronously when you select the Synchronize Traces option in the Windows menu.
Chapter 7: BitTracer Trace Files PETracer Software User Manual [page intentionally blank to preserve odd-even pagination] 82 Teledyne LeCroy
PETracer Software User Manual Chapter 8: Reports and Tools Chapter 8: Reports and Tools Reports assist you in analyzing traffic recorded by the Analyzer. The available reports are: • File Information: To view general information about the CATC Trace file. • Error Summary: To view a count of errors in a CATC Trace file.
Chapter 8: Reports and Tools PETracer Software User Manual 8.1 File Information The File Information window provides a summary on the currently displayed file. Select Reports > File Information 84 to obtain the File Information window.
PETracer Software User Manual Chapter 8: Reports and Tools 8.2 Error Summary The Error Summary dialog box displays the number of errors for each event and the packet containing the errors. Select Reports > Error Summary to obtain the Error Summary dialog box. AHCI Error Summary The AHCI Error Summary dialog is a sub-entry for the main Error Summary dialog. It displays the number of errors for each AHCI transaction containing the errors. Select Reports > Error Summary to open the Error Summary dialog .
Chapter 8: Reports and Tools PETracer Software User Manual Incomplete The AHCI transaction does not contain enough data or lower‐level transactions (Link or Split) are marked as incomplete. Logical Error One or more fields are in an inconsistent state relative to the other fields in the same or other registers. Read-only Field Changed The value of the read-only field differs from the previous one. Unknown The AHCI decoder is unable to decode a particular transaction correctly.
PETracer Software User Manual Chapter 8: Reports and Tools 8.3 Traffic Summary The Traffic Summary window summarizes the traffic in the current CATC Trace. The left side of the window displays a tree of protocol levels. The right side displays a summary of traffic for the displayed levels. Select Reports > Traffic Summary or click to display the Traffic Summary window.
Chapter 8: Reports and Tools PETracer Software User Manual Using the Traffic Summary Window to Search the CATC Trace You can use the Traffic Summary window to move the CATC Trace to packets of interest: Step 1 Click one of the numbers in the right side of the Traffic Summary window. The CATC Trace jumps to the first instance of the selected protocol. Step 2 Click the up or down arrows . The CATC Trace jumps forward or backward through the display to the next instance of selected protocol level.
PETracer Software User Manual Chapter 8: Reports and Tools Options. Opens a drop-down menu with the following options: • Grid Lines: Displays/Hides grid lines • Row Selection: Allows entire rows to be selected • Tight Columns: Reformats column widths to match data • Event Navigation: Skip Hidden Items Show Hidden Items Prompt each time 8.4 Bus Utilization Select Report > Bus Utilization from the menu or press window.
Chapter 8: Reports and Tools PETracer Software User Manual Bus Utilization Pop-up Menu You can reformat the display by right-clicking a graph and making a selection from the Bus Utilization pop-up menu. Go to Packet #: Relocates the CATC Trace to the selected packet number. Undo Zoom: If you have zoomed in, this command undoes the zoom. Zoom to Trace View: Zooms in on graph to show traffic currently displayed in the CATC Trace screen.
PETracer Software User Manual Chapter 8: Reports and Tools Properties: Opens a dialog box with options for changing the Title, Type, Appearance, and Color of the graphs.
Chapter 8: Reports and Tools PETracer Software User Manual Bus Utilization Buttons The Bus Utilization window buttons allow you to reformat the display and export data. Button Function Save. Saves Bus Utilization data to a bitmap file (*.bmp). Email. Opens an email and attaches a bitmap file of the Bus Utilization data. Print. Prints the Bus Utilization data. Full Screen. Maximizes the Bus Utilization window. Synchronize Views.Synchronize the current view with other open views. View Settings.
PETracer Software User Manual Chapter 8: Reports and Tools Horizontal zoom out Vertical zoom in Vertical zoom out Click and Drag zoom. Click and drag to zoom in on a part of the graph. Select Range. Displays a dialog box for selecting a packet range. Synchronize Graph Areas. If two or more graphs are displayed, this button synchronizes the graphs to one another. Once synchronized, the positioning slider of one graph moves the other graphs. Graph Areas.
Chapter 8: Reports and Tools PETracer Software User Manual 8.5 Link Tracker The Link Tracker window displays a detailed chronological view of events. Events are shown on a channel-by-channel basis in columns within the window. Each time slot in the vertical axis represents the minimum time that a DWORD requires to traverse the bus. Toolbar: Presents buttons for changing the format of the Link Tracker window. Main Display Area: Displays traffic chronologically as it occurred in the recording.
PETracer Software User Manual Chapter 8: Reports and Tools Note: When fully zoomed out, the smallest graphical unit is the DWORD, represented by a single line. Zooming out makes the CATC Trace appear smaller and increases the time scale in the first column.
Chapter 8: Reports and Tools PETracer Software User Manual Collapsing Idle Time, Enabling Tool tips, and Resetting Column Widths Click the View Options button to open a menu with options for formatting the display. Three options are presented: Collapsible Idle Time: Opens a dialog box for setting the Idle time value. Setting a value tells the Analyzer when to collapse Idle times and display them as grayed out strips within the Bus View window.
PETracer Software User Manual Chapter 8: Reports and Tools Setting Markers Markers can be set on any event within the Link Tracker window. To set a marker, right-click an event, then select Set Marker from the pop-up menu. Once marked, you can navigate to events with the Go to Marker command in the Search menu. Markers set in the Link Tracker window display the packet number and DWORD number. In contrast, markers set in the CATC Trace window just show the packet number.
Chapter 8: Reports and Tools PETracer Software User Manual Link Tracker Buttons The Link Tracker window has a row of buttons for changing the format of the displayed data and for exporting data: The buttons have the following functions: Full Screen. Expands the Link Tracker window to fill the entire screen. View Options. Opens a menu with three options: • Collapsible Idle Time (Collapse Idle Bigger Than n nanoseconds. Note: Does not affect Collapse Idle Plus.
PETracer Software User Manual Chapter 8: Reports and Tools Show Values Show Scrambled Values Show 10b Codes Show Symbols Show Text Show Binary values 8.6 Data Flow Window The Data Flow window shows marker, packet, direction, type, length, address, payload, handshake, and timestamp information. To obtain the Data Flow window, select Report > Data Flow or click the Data Flow toolbar icon.
Chapter 8: Reports and Tools • • • • • • • • • PETracer Software User Manual Marker Packet Direction Type Length Address Payload Handshake Time Stamp 8.7 Flow Control Tracking The Flow Control View mode highlights portions of the packets that affect flow control and displays flow control values. Flow control values shown at the beginning of Link Transaction display the credit values that were available prior to TLP transmission.
PETracer Software User Manual Chapter 8: Reports and Tools UpdateFC credit fields are different than the values in the first UpdateFC packet, Flow Control tracking view will show that the first UpdateFC packet is releasing appropriate amount of credits. By default, PETracer sets these values to match the first UpdateFC packets in the trace. 8.8 Using the CATC Trace Navigator The CATC Trace Navigator is a tool for navigating within the CATC Trace.
Chapter 8: Reports and Tools PETracer Software User Manual Displaying the Navigator Click in the toolbar to display the Navigator. The Navigator appears on the right side of the Main window. It has a two-button toolbar and a vertical slider bar. It also has colored panes for navigating the CATC Trace in different ways. You set which panes are displayed through Navigator pop-up menus. Navigator Toolbar The Navigator toolbar lets you quickly set Navigator features. The toolbar has two buttons.
PETracer Software User Manual Chapter 8: Reports and Tools Navigator Ranges You set the viewing range by dragging the yellow range delimiters along the slider. To set the lowest packet viewable, drag the top delimiter up. As you do so, a tool tip appears to indicate the current range. Stop dragging when you reach the desired lowest packet. To set the highest packet viewable, drag the bottom delimiter down. Stop when the tool tip indicates you are at the desired highest packet.
Chapter 8: Reports and Tools PETracer Software User Manual The menu has the following options: • • • Set Range to Whole Trace: Allows you to reset the range to include the entire CATC Trace file contents. The top range delimiter is placed at the lowest packet number in the CATC Trace. The bottom range delimiter is placed at the highest packet number in the CATC Trace.
PETracer Software User Manual Chapter 8: Reports and Tools Navigator Slider The Navigator slider appears at the left of Navigator panes. The slider has yellow upper and lower range delimiters and a blue current-position indicator. The Navigator slider lets you to set the range of packets viewable in the CATC Trace display. In other words, it sets scrolling range of the display. You can scroll the display up to the lowest packet number in the viewing range.
Chapter 8: Reports and Tools PETracer Software User Manual Using the Legend to Set the Priority of Information Display You can use the legend to set the priority of information displayed in the Pre/Post Trigger Traffic Type panes. This is a two-step process. Step 1 For a particular item in a pane, click the column next to the checkbox for the item. That labels the item as currently active. Step 2 Next, use the up-down at the lower-right of the area to move the item higher or lower in priority.
PETracer Software User Manual Chapter 8: Reports and Tools 8.9 LTSSM Flow Graph The LTSSM Flow Graph shows link state transitions that the link goes through, as recorded in the CATC Trace file. To obtain the LTSSM Flow Graph, select View > LTSSM Flow Graph. You can display the following directions: • • • Upstream Downstream Both You can Show Number of Transitions.
Chapter 8: Reports and Tools PETracer Software User Manual 8.10 Packet Header Bar The Packet Header bar shows packet header information. To obtain the Packet Header bar, select Report > Packet Header or click the Packet Header toolbar icon. The toolbar allows you to Save, go to Previous or Next, display Hexadecimal or Binary, and show the Packet Data window. 8.11 Packet Data Window The Packet Data window shows packet information.
PETracer Software User Manual Chapter 8: Reports and Tools The toolbar allows you to Save; go to Previous or Next; display Hexadecimal, ASCII, Decimal, or Binary; use MSB Format or LSB Format; and use Big Endian or Little Endian. Format and Columns allows you to enter the number of bytes, words, or dwords per line. You can enter an Offset and scroll to it. You can enter text and Search Previous or Search Next. 8.
Chapter 8: Reports and Tools PETracer Software User Manual Select Show Configuration Space for xxxx from the menu, where xxxx is the device number. The Configuration Space View opens. On the left, the view displays the Configuration Space for the selected CompleterID or DeviceID at the current packet. You can select Configuration Space Header or a Capability Structure. The right displays the decoded data of the selected Configuration Space Header or a Capability Structure, up to the current packet.
PETracer Software User Manual Chapter 8: Reports and Tools 8.13 Using Unit Metrics For every protocol unit at the Link or Split transaction level, PETracer™ calculates and displays a set of metrics. Metrics are measurements of key operating parameters. You can use metrics to evaluate performance of traffic in the CATC Trace stream. You can view metrics information in the CATC Trace display, the Traffic Summary window, and the Bus Utilization window.
Chapter 8: Reports and Tools PETracer Software User Manual Show Metrics in the CATC Trace Display In the CATC Trace view display of Link Transaction or Split Transaction levels, all metrics information applicable to a specific protocol unit is displayed in a Metrics header. The header is located close to the end of the unit, in front of the Time cell. You can expand and collapse the header to show or hide the metrics information.
PETracer Software User Manual Chapter 8: Reports and Tools Expanded Metrics Header Display When you expand the Metrics header, the display creates a separate cell for each applicable metric: Following is the expanded Metric header for a unit in the Split Transaction view. Following is the expanded Metric header for a unit in the Link Transaction view. Note: Each of the metric cells pops up a tool tip window with the explanation of what the metric means.
Chapter 8: Reports and Tools PETracer Software User Manual Write Requests Performance: This report table includes only the Split Transactions that present Write Requests (Configuration and IO). It groups them by the combination of Requester-Completer pair, request type, and Traffic Class and displays Minimum/Average/Maximum data for Throughput, Response Time, and Latency metrics.
PETracer Software User Manual Chapter 8: Reports and Tools value. This can help you to find specific units in the CATC Trace, such as transactions that produced spikes in Response Time or Throughput. Show Metrics in the Bus Utilization Window The Bus Utilization window provides graphs for packet-level information in the CATC Trace. The window also provides graphs for information on Split and Link Transaction levels, plotted over time.
Chapter 8: Reports and Tools PETracer Software User Manual Unit-Based Averaging The Analyzer builds metric graphs using unit-based averaging (as opposed to time-based averaging). For the total duration of a certain request (or Memory Write transaction), the graph value is assumed equal to the corresponding metric for this request (transaction).
PETracer Software User Manual Note: Chapter 8: Reports and Tools The Pending Requests graph is not directly defined by metrics, but it is useful when considering metrics. The Pending Requests graph presents the unit-averaged number of requests that were pending (in progress) at any moment of time. It allows you to correlate the number of requests posted to a completer with other performance metrics.
Chapter 8: Reports and Tools PETracer Software User Manual 8.14 TC to VC Mapping Select Tools > TC to VC Mapping displays how Traffic Classes are mapped to Virtual Channels (to simplify navigation) and how the CATC Trace display was changed (for example, in Split Transactions).
PETracer Software User Manual Chapter 8: Reports and Tools 8.15 Timing and Bus Usage Calculations The Timing and Bus Usage Calculator allows you to calculate time between packets. Select Tools > Timing Calculations to display the Timing Calculator dialog box. Total Time: Total time from beginning of the first unit to beginning of the second unit.
Chapter 8: Reports and Tools PETracer Software User Manual Bus Utilization This portion of the Timing Calculator window gives values that are cumulative for all packets during the timing period. For example, throughput is combined throughput of all packets during the timing period. Upstream is from endpoint devices to the root complex. Downstream is from the root complex to endpoint devices. Link Utilization: Percentage of non-idle symbols in total number of symbols transferred.
PETracer Software User Manual Chapter 8: Reports and Tools 8.16 PCIe SSD Base Address Mapping In order for NVMe, PQI, AHCI and ATA command to work correctly, the PETracer software needs to know the Memory Base Address of the device. In cases when Base Address assignment is recorded in the trace, the software will determine all the values automatically. If the Base Address assignment is not present in the trace, you can specify the values manually using this dialog.
Chapter 8: Reports and Tools PETracer Software User Manual Click the button to decode the trace and select Tools > PCIe SSD Base Address Mapping (see figure on next page).
PETracer Software User Manual Chapter 8: Reports and Tools The MBAR field in this dialog is required and editable. Make sure that the information entered is correct. Click on any field and the description displays in the bottom read-only box (see Figure 10.39 on page 215). Some important fields are described below: • Device: There is only one device node, (support for multiple device trace decoding will be available in a later release).
Chapter 8: Reports and Tools PETracer Software User Manual Clicking the Re-Decode button erases the current configuration from this dialog box and attempts to re-decode based on the information present in the open trace and/or saved on the disk with the last decode. Click the Import Config Info button to import the configuration information as an .xml file, instead of adding it individually. Click the hyper-link XML Schema File Path to access the required format to generate the .xml file.
PETracer Software User Manual Chapter 8: Reports and Tools All the fields in this dialog are required and editable. Make sure that the information entered is correct. Click on any field and the description displays in the bottom read-only box (see figure on next page). Some important fields are described below: • • • Teledyne LeCroy Device: There is only one device node, (support for multiple device trace decod-ing will be available in a later release).
Chapter 8: Reports and Tools PETracer Software User Manual The address is 64-bit and should be in "0x" hex format. Please use the right value for each size as it is an important attribute. Consult the NVMe specifications for the correct value. Clicking the Re-Decode button erases the current configuration from this dialog box and attempts to re-decode based on the information present in the open trace and/or saved on the disk with the last decode.
PETracer Software User Manual Note: Teledyne LeCroy Chapter 8: Reports and Tools Only one device should be marked with the appropriate BAR, multiple BARs do not work.
Chapter 8: Reports and Tools PETracer Software User Manual See“Example of XML File Format for SSD Decodes” on page 135 for a template of the XML files.
PETracer Software User Manual Chapter 8: Reports and Tools 8.17 Running Verification Scripts You can run verification scripts to check errors, link transactions, split transactions, metrics, ordered sets, replays, DLLPs, and TLPs. To obtain the Verification Script dialog box, select Tools > Run verification scripts or click the icon. The available verification scripts are in the Verification script section. To run a script, select it, then click the Run Scripts button .
Chapter 8: Reports and Tools PETracer Software User Manual Click the Settings button to display the Settings window. You can choose the editor, display settings, and saving settings.
PETracer Software User Manual Appendix A: Configuration Space Decoding Appendix A: Configuration Space Decoding The decoded capability structures in the Configuration Space Viewer and Editor are based on programmed definitions in the PETracer software and on Configuration Space Decode Scripts. Configuration Space Decode Scripts are tools to define capability structures and instruct the Configuration Space Viewer or Editor how to decode them.
Appendix A: Configuration Space Decoding PETracer Software User Manual A.3 Configuration Register Types The following reserved variables are defined global constants. • CFGREG_UNDEFINED • CFGREG_HWINIT • CFGREG_RO • CFGREG_RW • CFGREG_RW1C • CFGREG_ROS • CFGREG_RWS • CFGREG_RW1CS • CFGREG_RSVDP • CFGREG_RSVDZ Note: These reserved variables match the Configuration Register Types of Table 7-2 in Section 7.4 of the PCI Express Base Specification, Rev. 2.1. A.
PETracer Software User Manual Appendix A: Configuration Space Decoding AddField( field_name, field_length, configuration_reg_type, tooltip, encoding_table = NULL ) This function adds a register field to the Capability View and returns a pointer to the field, for adding subfields. • • • • • • field_name: Name of the register field to display in the Capability View field_length: Length of the register field configuration_reg_type: Configuration register type of the register field.
Appendix A: Configuration Space Decoding 134 PETracer Software User Manual Teledyne LeCroy
PETracer Software User Manual Appendix B: Example of XML File Format for SSD Decodes Appendix B: Example of XML File Format for SSD Decodes PAGE 142Appendix B: Example of XML File Format for SSD Decodes PETracer Software User Manual
PETracer Software User Manual Appendix B: Example of XML File Format for SSD Decodes Teledyne LeCroy 137
Appendix B: Example of XML File Format for SSD Decodes 138 PETracer Software User Manual Teledyne LeCroy
PETracer Software User Manual Appendix C: China Restriction of Hazardous Substances Table Appendix C: China Restriction of Hazardous Substances Table The following tables are supplied in compliance with China's Restriction of Hazardous Substances (China RoHS) requirements: Teledyne LeCroy 139
Appendix C: China Restriction of Hazardous Substances Table 140 PETracer Software User Manual Teledyne LeCroy
PETracer Software User Manual How to Contact Teledyne LeCroy How to Contact Teledyne LeCroy Type of Service Call for technical support… Contact US and Canada: 1 (800) 909-7112 Worldwide: 1 (408) 653-1260 Fax your questions… Worldwide: 1 (408) 727-6622 Write a letter… Teledyne LeCroy Protocol Solutions Group Customer Support 3385 Scott Blvd. Santa Clara, CA 95054-3115 USA Teledyne LeCroy Send e-mail… psgsupport@teledynelecroy.com Visit Teledyne LeCroy’s web site… teledynelecroy.
How to Contact Teledyne LeCroy PETracer Software User Manual [page intentionally blank to preserve odd-even pagination] 142 Teledyne LeCroy
PETracer Software User Manual Index Index Numerics markers 72 mode 69 report windows 71 saving 81 search 78 Symbol window 75 timing 72 Timing window 73 views 69 zooming 81 BitTracer Files 17 blue current-position indicator 105 Both directions 107 Bus Utilization 83, 89, 120 buttons 92 features 116 metrics 115 pop-up menu 90 10b errors 74 10-bit code format 70 C Symbols .opt files 68 .peraw file extension 81 .
Index CSV files 19 current-position indicator 105 D Data Block window 23 data cells 22 Data Field 21 Data Flow 83 Data Flow command 99 Data Flow window 99 Data Throughput 111, 120 decode levels 34 decoding 34 Decoding window 77 default.
PETracer Software User Manual H Index hardware 1 header fields 25 Help Menu 15 Hexadecimal vs.
Index Msb -> Lsb checkboxes 66 Multi-Segment Toolbar 8 N navigating 101 Navigator 101 displaying 102 legend 105 panes 102, 104 range 103 ranges 102 slider 105 toolbar 102 Navigator Legend dialog box 105 Navigator Panes button 105 Navigator Range button 103 Number of Link Transactions 111 Number of Packets 111 NVM level decode 35 NVMe PCIe SSD Device Configuration 121 O opening program 4 Origin field 56 P Packet # 63 Packet Data 83 Packet Data command 108 Packet Data window 108 Packet Directionality Cell
PETracer Software User Manual scrambled format 70 Search command 37 Search Bwd message 55 Search Direction command 54 Search For menu 56 Search Fwd message 55 Search Menu 13 Search On section 78 Search Order section 78 Search Pattern window 78 Search window BitTracer 78 searching 37 Seconds radio button 38 servicemarks ii Set Display Options command 63 Set End Quick Timing Marker 26 Set Marker command 28, 97 Set Marker with Text command 72 Set Range Near Packet xxx 104 Set Range to Whole Trace 104 Set Star
Index PETracer Software User Manual moving to packets 88 Traffic Type pane 104 triangle 21 Trigger marker 72 TS1 and TS2 Event Groups 58 U Undo Zoom 90 Union option 57 unit 111 unit-based averaging 116 Upstream direction 107 user-defined markers 72 V Verification Script dialog box 129 View Data Block command 23, 24 View Menu 14 View Options 98 View Options button 96 View Settings 92 Viewer 4 Viewing Attachments of a Marker 44 W web site 141 Website, CATC 141 Window Menu 15 Wrap 62 Write Requests Perfor