
Users Manual Instruction Manual


118
CATC FIREINSPECTOR 2.01 CHAPTER 9
User’s Manual Reports
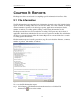
To access the menu, click the View Settings icon on the Bus Utilization toolbar.
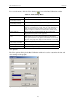
View Options
The View options dialog in the Bus Utilization window is used to customize the font and
color settings of the graphs.
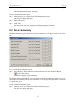
Table 9-1: View Settings Menu
Command Descripton
Orient
horizontally/vertically
Positions the Time axis of the graphs horizontally or vertically.
Tile
horizontally/vertically
Positions the graph displays side by side or one atop another.
Show markers Displays or hides the position of markers in the graph. Markers are
shown as a red dashed line in a graph. At the top of the dashed line is a
small options arrow. Placing the mouse pointer over the arrow will
display a tooltip that contains the text of the marker comment, if any.
Show plumb line Shows or hides the perpendicular plumb line that is visible when
dragging the mouse pointer over the graph area.
Status > Bar, Tooltip, or
None
Displays status information in the status bar, as a tooltip, or not at all.
When enabled, you can view status information by positioning the
mouse pointer anywhere in the graph area. Information associated with
that point on the graph will be displayed on the status bar or as a tooltip.
Grid lines > Both Axes, X
Axis, Y Axis, or No Grid
Defines the display of grid lines in the graphs.
Grid on top When enabled, grid lines will overlay the bars/lines of the graphs.
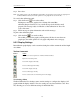
Fonts and Colors Opens the View Options dialog.
Figure 9-6: View Options dialog