
Users Manual User Manual

Protocol Analysis
98
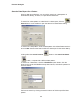
Customize the Display
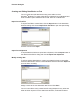
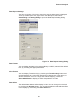
You can select for display only specific items for a specific project. To set up
the display, click the Report Display Settings button on the
Data Report Statistics Toolbar.
Figure 76 Report Display Settings Dialog
Uncheck the items to exclude from the display.
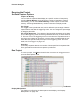
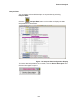
Display Histogram
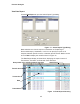
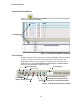
Click the Histogram button on the data report toolbar to display a
histogram of data byte values
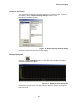
Figure 77 Data Byte Value Histogram
Position the mouse cursor over byte value to display a numeric message for
that byte value.