
User Manual

AORM Software Package
923133 Rev A ISSUED: June 2013 87
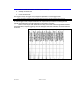
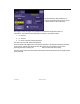
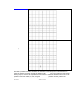
The XY plot has been
adjusted so that all the pit
widths are displayed vs.
time. Notice that all f orm
bands. This is because all
but two are ideal integer
multiples of the clock
period. Th e two pit widths
dissimilar to the others
are sitting just below the
3T pit width band, and
between th e 4T and the
5T band. These strange
pit widths occurred
around the mi ddle of the
waveform.
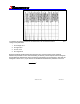
Using time cursors, it
can be seen that the
beginning of this
problematic pit widt h
occurred at pit # 973,
859.61
µ
s from the
trigger. This smaller-
than-normal pi t is
245.40 ns.
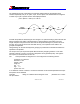
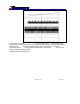
Now that a problem has been identified, we would like to view the portion of the waveform in
which the problem occurred. Change the display mode Single grid. Turn off the two trend traces,
leaving only F3, which is the expanded trace of Channel 1. Move the absolute time cursor to the
position in the trace at 859 µs; and, using the WAVEPILOT position controls, position the