
User Manual

86 ISSUED: June 2013 923133 Rev A
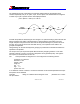
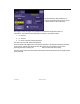
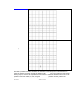
The waveforms are
displayed in Quad grid
mode. The trend of
t@pit is basically linear,
as expected because
the time at each pit from
the trigger is a scending.
The trend of the pit
widths look s basicall y
as expected. Notice that
there are exactly as
many event s inside bot h
trends, a necessary
condition.
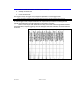
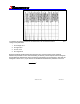
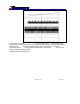
From the menu bar, select Display Setup… and set the grid mode to XY. Bands of pit widths
corresponding to widths that are ideal integer multiples of the clock period will be evident. Select
F2 (the trend of t@pit) and zoom to expand the time scale. Then select F1 (the trend of pwid)
and use the vertical Z
OOM knob to adjust the band spacing. The vertical POSITION knob can be
used to position the display vertically.
The next screens show the XY plot.