
User Manual

AORM Software Package
923133 Rev A ISSUED: June 2013 75
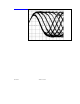
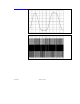
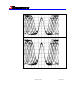
Example
Consider the following
persistence plots. In
the first, the amplitude
measurement cursor
reads the difference
between the 3T top
and base: 47.3 mV .
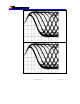
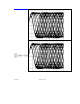
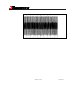
In the second, the
cursor reads the
difference between the
11T top and base:
67.3 mV.
Therefore, the
resolution is: