User Manual
Manuals
Brands
Teledyne LeCroy Manuals
Software
AORM - Advanced Optical Recording Measurements
71
72
73
74
75
76
77
78
79
80
AORM Software Package
923133
Rev
A
ISSUED:
June 2013
69
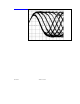
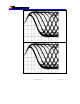
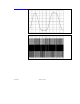
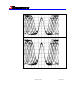
Example
The following
persistence p
lots were
generated using the
DC-coupled signal.
In the first plot, the
amplitude
measurement cursor is
reading the 11T top
voltage of 76.7 mV
1
...
...
69
70
71
72
73
...
...
125