
User Manual

AORM Software Package
923133 Rev A ISSUED: June 2013 57
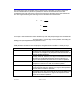
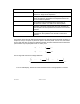
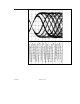
Example
Consider this
persistence plot of an
optical data
waveform. Using
cursors, the average
amplitude of the 3T
pits/spaces can be
estimated. In this
case, the value
obtained is 47.2 mV.
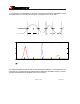
When the param eter
paa is configured for
3T widths, the
measurement result is
also 47.2 mV. This
value is calcul ated
automatically.