
User Manual

46 ISSUED: June 2013 923133 Rev A
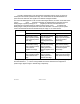
Display Options
ORM parameter calculations can be displayed, histogrammed, and trended in a variety of ways.
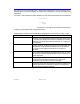
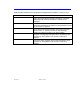
DISPLAY TYPE VALUE DISPLAYED
Parameter Statistics Off
Single value of the average time between the edges of the subject
n pit (space) and nearest clock edges for all subject pits (spaces)
that are preceded and followed by the specified space (pits) for
the last acquisition.
Parameter Statistics On
Average, minimum, maximum, and sigma of the beginning and
ending edge shift calculated for all subject pits (spaces) that are
preceded and followed by the specified space (pits) for all
acquisitions since the last C
LEAR SWEEPS operation.
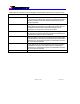
nT Table
List of values of the beginning edge shift and the ending edge shift
for all subject pits (spaces) that are preceded and followed by the
specified space (pits) for the last acquisition.
Histogram Function
Histogram graph of the values of the beginning and ending edge
shift calculated for all subject pits (spaces) that are preceded and
followed by the specified space (pits) for all acquisitions since the
last C
LEAR SWEEPS operation.
Trend Function
Trend graph of the value of the beginning and ending edge shift
calculated for all subject pits (spaces) that are preceded and
followed by the specified space (pits) for all acquisitions since the
last C
LEAR SWEEPS operation.
XY Plot
XY Plot displays the trend of one parameter vs. another.