
User Manual

98 ISSUED: June 2013 923133 Rev A
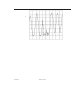
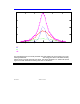
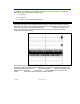
This is what the XY plot looks like:
The XY plot has been
adjusted so t hat all of
the pit tops are
displayed vs. Pit width.
Notice that all of the pit
widths form clusters.
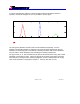
Press N
ORMAL trigger,
and the clust ers will
become even more
dense. You can have up
to 20,000 poin ts in the
XY plot.
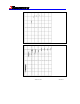
Usin
g the XY cursors, a
variety of
measurements can be
performed
simultaneously. For
example, here it ca n be
seen that the 5T pit
width varies by
approximately 82 ns
and the top varies by
approximately 2.58 mV.
Of course these co uld
be seen through
automatic parameter
calculations wi thout
using XY plots, but the
XY plot can sometimes
provide information that
would not otherwise be
observable.