User manual
Table Of Contents
- toc
- General safety summary
- Compliance Information
- Preface
- Getting Started
- Operating Basics
- Understanding Oscilloscope Functions
- Application Examples
- Taking Simple Measurements
- Using Autorange to Examine a Series of Test Points
- Taking Cursor Measurements
- Analyzing Signal Detail
- Capturing a Single-Shot Signal
- Measuring Propagation Delay
- Triggering on a Specific Pulse Width
- Triggering on a Video Signal
- Analyzing a Differential Communication Signal
- Viewing Impedance Changes in a Network
- Data Logging
- Limit Testing
- Math FFT
- USB Flash Drive and Device Ports
- USB Flash Drive Port
- File Management Conventions
- Saving and Recalling Files With a USB Flash Drive
- Using the Save Function of the Print Front Panel Button
- USB Device Port
- Installing the PC Communications Software on a PC
- Connecting to a PC
- Connecting to a GPIB System
- Command Entry
- Connecting to a Printer
- Printing a Screen Image
- Reference
- Appendix A: Specifications
- Appendix B: TPP0101 and TPP0201 Series 10X Passive Probes Inform
- Appendix C: Accessories
- Appendix D: Cleaning
- Appendix E: Default Setup
- Appendix F: Font Licenses

Application Examples
Analyzing Sig
nal Detail
You have a noisy signal displayed on the oscilloscope and you need to know more
about it. You suspect that the signal contains much m ore detail than you can
now see in the
display.
Looking at a Noisy Sign al
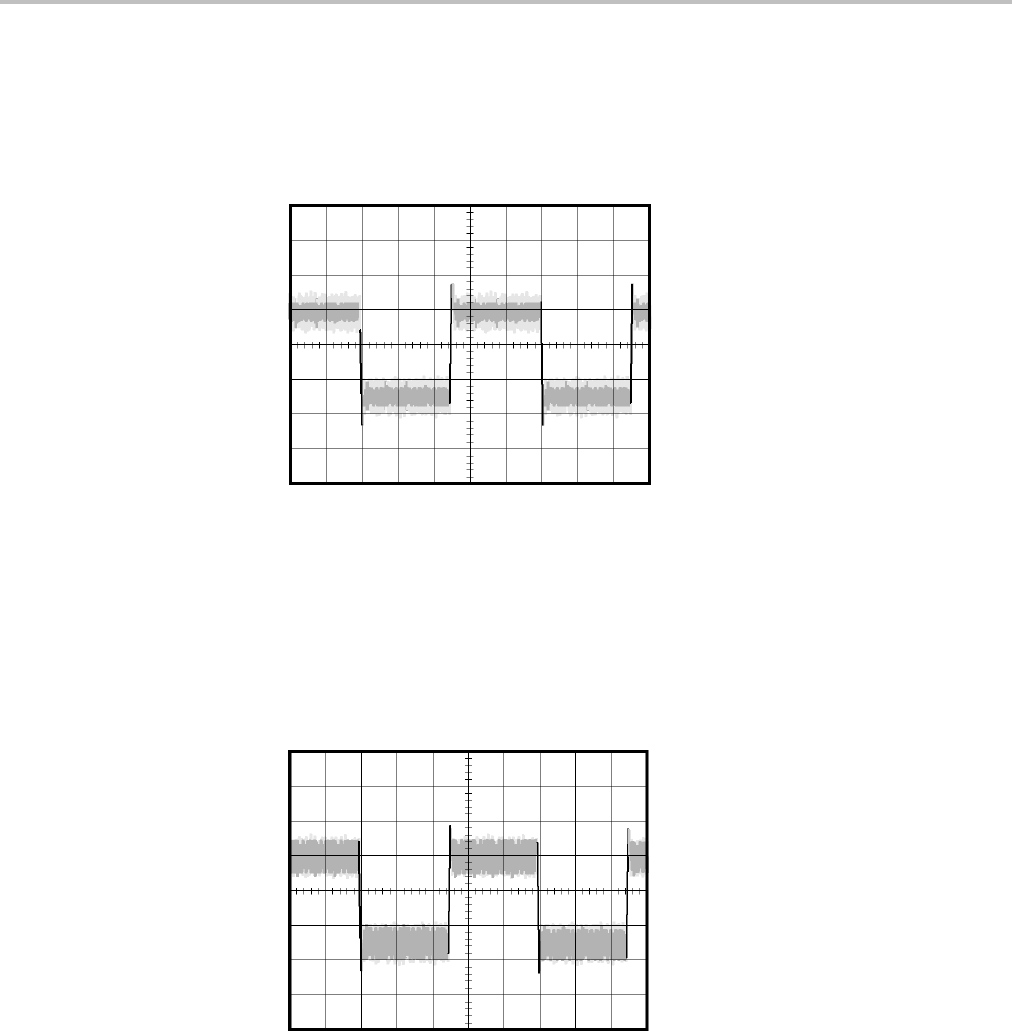
The signal appears noisy and you suspect that noise is causing problems in your
circuit. To better analyze the noise, follow these steps:
1. Push the Acquire button to see the Acquire Menu.
2. Push the Peak Detect option button.
Peak detect emphasizes noise spikes and glitches in your signal, especially when
the time base is set to a slow setting.
Separating the Signal from
Noise
Now you want to analyze the signal shape and ignore the noise. To reduce random
noise in the oscilloscope display, follow these steps:
1. Push the Acquire button to see the Acquire Menu.
2. Push the Average option button.
3. Push the Averages option button to see the effects of varying the number of
running averages on the waveform display.
40 TBS1000 Series Oscilloscopes User Manual


