
Data Sheet
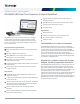


DataVu-PC for multi-instrument recording
and analysis of large recordings
DataVu-PC software can control two spectrum analyzers simultaneously
with independent settings. This allows you to monitor a wide span, while
recording at up to 40 MHz bandwidth at any frequency in the range of the
instrument. Once recorded, DataVu-PC can find and mark signals of
interest based on amplitude and frequency-mask characteristics,
eliminating the need for manual inspection of long recordings. Pulse
measurements are available on up to 2,000,000 pulses.
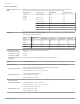
Measurements included in SignalVu-PC base
version
Basic functionality of the free SignalVu-PC program is far from basic. The
table below summarizes the measurements included in the free SignalVu-
PC software.
General signal analysis
Spectrum analyzer Spans from 1 kHz to 6.2 GHz
Three traces plus math and spectrogram
trace
Five markers with power, relative power,
integrated power, power density and
dBc/Hz functions
DPX Spectrum/Spectrogram Real time display of spectrum with 100%
probability of intercept of 27 μsec signals
in up to 40 MHz span
Amplitude, frequency, phase vs. time,
RF I and Q vs. time
Basic vector analysis functions
Time Overview/Navigator Enables easy setting of acquisition and
analysis times for deep analysis in
multiple domains
Spectrogram Analyze and re-analyze your signal with
a 2-D or 3-D waterfall display
AM/FM listening Hear, and record to file, FM and AM
signals
Analog modulation analysis
AM, FM, PM analysis Measures key AM, FM, PM parameters
RF measurements
Spurious measurement User-defined limit lines and regions
provide automatic spectrum violation
testing across the entire range of the
instrument; Four traces can be saved
and recalled; CISPR Quasi-Peak and
Average detectors available with option
SVQP
Spectrum emission mask User-defined or standards-specific
masks
Occupied Bandwidth Measures 99% power, -xdB down points
Channel Power and ACLR Variable channel and adjacent/alternate
channel parameters
MCPR Sophisticated, flexible multi-channel
power measurements
CCDF Complementary Cumulative Distribution
Function plots the statistical variations in
signal level
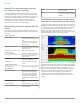
The RSA306B with SignalVu-PC offers basic
and advanced measurements for field and lab
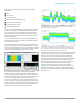
See what you've never seen before: The 40 MHz real time bandwidth of the
RSA306B combined with the processing power of SignalVu-PC shows you
every signal, even down to 27 μs in duration when a high performance PC
is used. The following image shows a WLAN transmission (green and
orange), and the narrow signals that repeat across the screen are a
Bluetooth access probe. The spectrogram (upper part of the screen) clearly
separates these signals in time to show any signal collisions.
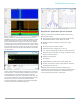
Monitoring has never been easier. Spectrum mask testing captures detail of
transients found in the frequency domain, such as intermittent interference.
Mask testing can be set to stop acquisition, save acquisition, save a
picture, and send an audible alert. The following image shows a spectrum
mask (in orange on the spectrum display) created to monitor a band of
frequencies for violations. A single transient of 125 μs duration has
occurred that violated the mask, with the violation shown in red. The
transient is clearly seen on the spectrogram above the red violation area
(circled).
Datasheet
2 www.tek.com