
Data Sheet
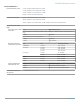


WLAN Measurements 802.11ac
(SV25xx-SVPC)
Measurements WLAN power vs. time; WLAN symbol table; WLAN constellation; spectrum emission mask; error vector magnitude (EVM) vs.
symbol (or time), vs subcarrier (or frequency); mag error vs symbol (or time), vs. subcarrier (or frequency); phase error vs symbol
(or time), vs. subcarrier (or frequency); channel frequency response vs. symbol (or time), vs. subcarrier (or frequency); spectral
flatness vs. symbol (or time), vs. subcarrier (or frequency)
EVM performance - 802.11ac,
256-QAM, typical
5.8 GHz, 40 MHz BW : -35 dB
Input signal level optimized for best EVM, average of 20 bursts, ≥16 symbols each
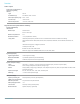
APCO P25 Measurements
Application (SV26xx-SVPC)
Measurements RF output power, operating frequency accuracy, modulation emission spectrum, unwanted emissions spurious, adjacent channel
power ratio, frequency deviation, modulation fidelity, frequency error, eye diagram, symbol table, symbol rate accuracy, transmitter
power and encoder attack time, transmitter throughput delay, frequency deviation vs. time, power vs. time, transient frequency
behavior, HCPM transmitter logical channel peak adjacent channel power ratio, HCPM transmitter logical channel off slot power,
HCPM transmitter logical channel power envelope, HCPM transmitter logical channel time alignment, cross-correlated markers
Modulation fidelity, typical C4FM = 1.3%
HCPM = 0.8%
HDQPSK = 2.5%
Input signal level is optimized for best modulation fidelity.
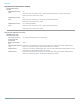
Bluetooth Measurements
Application (SV27xx-SVPC and
SV31xx-SVPC)
Supported standards Bluetooth
®
4.2 Basic Rate, Bluetooth
®
4.2 Low Energy, Bluetooth
®
4.2 Enhanced Data Rate. Bluetooth
®
5 when SV31 is enabled.
Measurements Peak Power, Average Power, Adjacent Channel Power or InBand Emission mask, -20 dB Bandwidth, Frequency Error, Modulation
Characteristics including ΔF1avg (11110000), ΔF2avg (10101010), ΔF2 > 115 kHz, ΔF2/ΔF1 ratio, frequency deviation vs. time
with packet and octet level measurement information, Carrier Frequency f0, Frequency Offset (Preamble and Payload), Max
Frequency Offset, Frequency Drift f
1
-f
0
, Max Drift Rate f
n
-f
0
and f
n
-f
n-5
, Center Frequency Offset Table and Frequency Drift table,
color-coded Symbol table, Packet header decoding information, eye diagram, constellation diagram
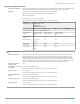
Output power (BR and LE),
typical mean
Supported measurements: Average power, peak power
Level uncertainty: refer to instrument amplitude and flatness specification
Measurement range: signal level > –70 dBm
Modulation characteristics,
typical mean
Supported measurements: ΔF
1
avg, ΔF
2
avg, ΔF
2
avg/ ΔF
1
avg, ΔF
2
max%>=115kHz (basic rate), ΔF
2
max%>=115kHz (low energy)
Deviation range: ±280 kHz
Deviation uncertainty (at 0 dBm):
2 kHz + instrument frequency uncertainty (basic rate)
3 kHz + instrument frequency uncertainty (low energy)
Measurement range: Nominal channel frequency ±100 kHz
Initial Carrier Frequency
Tolerance (ICFT) (BR and LE),
typical mean
Measurement uncertainty (at 0 dBm): <1 kHz
2
+ instrument frequency uncertainty
Measurement range: Nominal channel frequency ±100 kHz
Carrier Frequency Drift (BR
and LE), typical mean
Supported measurements: Max freq. offset, drift f
1
- f
0
, max drift fn-f
0
, max drift fn-f
n-5
(BR and LE 50 μs)
Measurement uncertainty: <2 kHz + instrument frequency uncertainty
Measurement range: Nominal channel frequency ±100 kHz
In-band emissions (ACPR) (BR
and LE)
Level uncertainty: refer to instrument amplitude and flatness specification
2
At nominal power level of 0 dBm
RSA306B USB Spectrum Analyzer
SignalVu-PC application licenses
www.tek.com 17