
Data Sheet
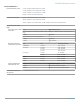


Direct audio measurements Signal power, Audio frequency (+Peak, -Peak, Peak-Peak/2, RMS), SINAD, Modulation distortion, S/N, Total harmonic distortion,
Total non-harmonic distortion, Hum and Noise (Direct audio measurements are limited to >9 kHz by input frequency)
Audio filters Low pass, kHz: 0.3, 3, 15, 30, 80, 300, and user-entered up to 0.9 × audio bandwidth
High pass, Hz: 20, 50, 300, 400, and user-entered up to 0.9 × audio bandwidth
Standard: CCITT, C-Message
De-emphasis (μs): 25, 50, 75, 750, and user-entered
File: User-supplied .TXT or .CSV file of amplitude/frequency pairs. Maximum 1000 pairs
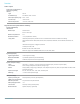
Performance
characteristics, typical
Conditions: Unless otherwise stated, performance is given for:
Modulation rate = 5 kHz
AM depth: 50%
PM deviation 0.628 Radians
FM AM PM Conditions
Carrier Power accuracy Refer to instrument amplitude accuracy
Carrier Frequency
accuracy
± 7 Hz + (transmitter
frequency × ref. freq.
error)
Refer to instrument
frequency accuracy
± 2 Hz + (transmitter
frequency × ref. freq.
error)
Depth of Modulation
accuracy
NA ± 0.5% NA
Deviation accuracy ± (2% × (rate +
deviation))
NA ± 3%
Rate accuracy ± 0.2 Hz ± 0.2 Hz ± 0.2 Hz
Residual THD 0.5% 0.5% NA
Residual SINAD 49 dB
40 dB
56 dB 42 dB
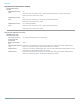
Pulse measurements (SVPxx-
SVPC)
Measurements (nominal) Pulse-Ogram
™
waterfall display of multiple segmented captures, with amplitude vs time and spectrum of each pulse. Pulse
frequency, Delta Frequency, Average on power, Peak power, Average transmitted power, Pulse width, Rise time, Fall time,
Repetition interval (seconds), Repetition interval (Hz), Duty factor (%), Duty factor (ratio), Ripple (dB), Ripple (%), Droop (dB),
Droop (%), Overshoot (dB), Overshoot (%), Pulse- Ref Pulse frequency difference, Pulse- Ref Pulse phase difference, Pulse-
Pulse frequency difference, Pulse- Pulse phase difference, RMS frequency error, Max frequency error, RMS phase error, Max
phase error, Frequency deviation, Phase deviation, Impulse response (dB),Impulse response (time), Time stamp.
Minimum pulse width for
detection, typical
150 ns
Average ON power at 18 °C to
28 °C, typical
±1.0 dB + absolute amplitude accuracy
For pulses of 300 ns width or greater, duty cycles of .5 to .001, and S/N ratio ≥ 30 dB
Duty factor, typical ±0.2% of reading
For pulses of 450 ns width or greater, duty cycles of .5 to .001, and S/N ratio ≥ 30 dB
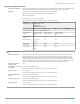
Average transmitted power,
typical
±1.0 dB + absolute amplitude accuracy
For pulses of 300 ns width or greater, duty cycles of .5 to .001, and S/N ratio ≥ 30 dB
Peak pulse power, typical ±1.5 dB + absolute amplitude accuracy
For pulses of 300 ns width or greater, duty cycles of .5 to .001, and S/N ratio ≥ 30 dB
Pulse width, typical ±0.25% of reading
For pulses of 450 ns width or greater, duty cycles of .5 to .001, and S/N ratio ≥ 30 dB
RSA306B USB Spectrum Analyzer
SignalVu-PC application licenses
www.tek.com 15