
User Manual
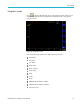
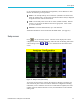


Front panel
As with the inte
grator itself, the results are displayed on a group-by-group basis.
This means that the maximum number of plot lines is four, which will occur in a
3p4w system with sum results. There is the option of adding or removing plot
lines from the display within the constraints of the group. For example, you could
select to see the Channel 1 result and the Sum result.
There are two reasons for allowing this selection:
In a balanced three-phase system, t he integrated readings for eac h channel
will be very similar and so the plot lines will be overlaid one on top of the
other. This could lead to confusion.
Again in a balanced three phase system, if a channel and the sum results are
displayed on the same graph, the channel plot will never come higher up the
Y axis than 1/3 way, at best. Removing the sum result and rescaling the Y
axis all
ows better resolution for the channel plot.
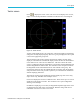
At the top of the display is a reading for each channel in the group (including the
Sum cha
nnel). The reading is for the same result as is selected in the integrator
waveform setup screen to display on the screen, for example, if the plot is WHrs,
then the reading is WHrs.
The plot is always in the same color as the channel designator.
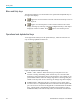
At any
time while the integration graph is being displayed, pressing the left
or right arrow hard keys will change to group results. If only one group is in
integrator mode, then graph will not change.
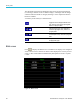
Both the X and Y axes are automatically scaled. For the Y axis, the time will
change automatically as the integration time increases. This allows for the best
viewing of the graph.
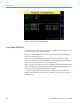
Any time during integration, you change the plots by pressing the INT soft
key. This takes you directly to the integrator waveform setup menu with the
appropriate group selected.
18 PA3000 Power Analyzer User Manual