
User Manual


Front panel
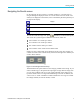
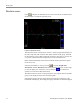
When drawing a w
aveform, the phase reference signal for the group is started
at the intersection of the X and Y a xes. Choosing to display or not display the
reference waveform will not affect the position of the other waveforms. For
example, if Channel 1 volts was the phase reference and Channel 1 amps was 90
degrees lagging, but Channel 1 volts was not displayed, then Channel 1 amps
would still start at 90 degrees lagging.
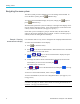
For the X (time) axis, the range will be twice the period of the lowest frequency
signal being displayed, rounded up to time starting with 1, 2 or 5. For example, if
50 Hz is the lowest frequency, then twice the period would be 40 ms, and 50 ms
would be the time base. If there is no frequency measured on any of the displayed
waveforms (all DC), then 500 ms will be used for the time base.
For the Y axis the range for all the displayed channels of the same units (volts,
amps,orwatts)isexamined.Themaximumrangeistherangeused.
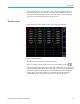
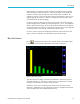
Bar chart screen
Press to display the Bar chart screen. The Bar chart screen displays either
volts, amps or watts harmonic information in the form of a bar chart.
Figure 9 : Bar chart screen
The data used for the display is based on the harmonics setup for the group in
which the channel is in. All soft key actions are on a per-group basis. The left
and right arrow hard keys are used to change channel.
Harmonics do not need to be displayed as results for the bar chart to show
harmonics. If harmonics are never displayed, and never configured, then the b ar
chart would be based on the default harmonic setup.
PA3000 Power Analyzer User Manual 15