
User Manual


Front panel
Wa veform scre
en
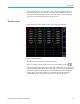
Press to display the Waveform screen. This screen shows w aveforms of the
measured data in continuous operating mode.
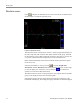
Figure 8: Waveform screen
The Waveform screen consists of two sections. At the top right of the display are
the volts, amps and watts values for each of the channels in the group. The label
for the channel is color coded to match the waveform. (See page 53, Graphs and
waveforms.) Measurements are displayed even if the waveform is not.
Below these measurements is the actual waveform which is plotted out against
the X and Y axes.
Select the waveforms to view by pressing
, selecting Graphs and
Waveforms,andthenWaveform followed by the actual selection of volts, amps,
or watts to display as a waveform. You can also press
as a shortcut to
qu
ickly access the Select Waveforms menu.
Waveform selection is done on a per-group basis. Only signals within a specified
g
roup can be displayed on the same waveform graph.
Changing the group is done by using the left and right arrow hard keys at the
b
ottom left of the display. This changes the group of and the waveforms displayed.
14 PA3000 Power Analyzer User Manual