
User Manual


Getting started
Results screen
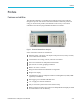
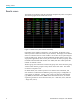
The Results screen displays after the instrument completes the power-on sequence.
The following figure shows the Results screen.
Figure 3: Result screen (four-channel instrument)
Depending on the number of channels in your instrument, the Results screen
shows up to four columns of results (one per channel). The display can be broken
down into columns and rows. Each column is one of four colors representing the
resul
ts for that group. There can be many different columns within a group. In a
single-phase application, there can only be one column of results per group. If the
minimum and maximum hold columns were added, then this would expand the
number of columns to three.
Within a group, the result name is listed in the group color on the left of the group.
All the results with the group are a lways shown in the same order. The results
are shown on sepa rate rows.
In default mode, each column represents one channel of the instrument, and
each channel is contained with a different group. Each group is configured as a
wiring setup, for example: 1 phase, 2 wire. Each row shows the measurement
t
ype Vrms, the measured value, 248.4 and the measurement units, V.Normal
engineering notation is u sed to describe u nits, mV = millivolts (10e-3) and MV
= megavolts (10e+6).
6 PA3000 Power Analyzer User Manual