
User Manual


Application examples
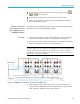
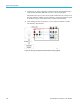
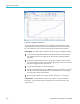
Figure 52: Integration Trend chart
The Trend chart can be activated for any integration measurement by either
right-c
licking the desired parameter or by clicking the Trend icon on the menu
bar. The Trend chart can be reset by using the Reset button on the menu bar.
Data logging. Recording data is important for m ost energy consumption testing.
To record data using PWRVIEW, click the Record button on the menu bar.
The software will start recording all the selected data including formulas
and limits.
To change the data logging rate or to set the total log time, click the down
arrow on the Record icon to open the data logging setup. Here you can select
the desired logging duration and interval.
To stop the data logging, click the Stop button.
All the recorded data is stored in a database o n the local computer. To access
the data, click the Results tab and then click the Measure icon. The dialog
box will present all the archived data.
Select the desired d ata set and export to either an Excel or a .csv format.
Custom limits. Custom limits can also be set with any of the measurement
parameters. Custom limits help set limits based on various standards or test
specifications.
126 PA3000 Power Analyzer User Manual