
User Manual


Application examples
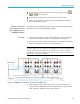
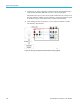
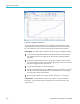
Figure 49: Harmonic bar chart
Waveforms in the PWRVIEW software are constructed using the harmonic
data collected from the PA3000. The accuracy of the waveform depends on
the harmonic information available. For optimum results, select the maximum
number of harmonics to display in the setup area. Selecting 100 harmonics
for the PA3000 gives the best results. If no ha
rmonics are selected, waveform
feature will display a blank screen.
The Harmonic bar chart can be enabled for all voltage, current, and watts
measurements. Up to 100 harmonics can be sele cted through the setup
screen. Hovering over any harmonic bar will display the absolute value and
percentage of fundamental for that harmonic.
The Trend chart can activated for any measurement parameter by either
right-clicking the desired parameter or by clicking the Trend icon on menu
bar. The Trend chart can be reset by clicking the Reset button on the menu bar.
Data logging. Recording data is important for most efficiency measurements
where load and source sweep is required.
To record data using PWRVIEW, click the Record button on the menu bar.
The software will start recording all the selected data including formulas
and limits.
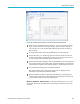
To change the data logging rate or to set the total log time, click the down
arrow on the Record icon to open the data logging setup. Here you can select
the desired logging duration and interval.
To stop the data logging, click the Stop button.
120 PA3000 Power Analyzer User Manual