
Datasheet


www.tektronix.com/oscilloscopes 3
Debugging Serial Buses in Embedded System Designs
Parallel vs. Serial
With a parallel architecture, each component of the bus has
its own signal path. There may be 16 address lines,16 data
lines, a clock line and various other control signals. Address
or data values sent over the bus are transferred at the same
time over all the parallel lines. This makes it relatively easy to
trigger on the event of interest using either the State or Pattern
triggering found in most oscilloscopes and logic analyzers.
It also makes it easy to understand at a glance the data you
capture on either the oscilloscope or logic analyzer display. For
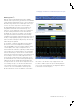
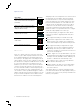
example, in Figure 1 we’ve used a logic analyzer to acquire the
clock, address, data and control lines from a microcontroller.
By using a state trigger, we’ve isolated the bus transfer we’re
looking for. To “decode” what’s happening on the bus, all we
have to do is look at the logical state of each of the address,
data, and control lines. With a serial bus all this information is
sent serially on a few conductors (sometimes one). This means
that a single signal may include address, control, data, and
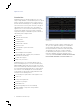
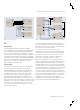
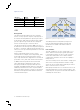
clock information. As an example, look at the Controller Area
Network (CAN) serial signal shown in Figure 2.
This message contains a start of frame, an identifier (address),
a data length code, data, CRC, and end of frame as well as a
few other control bits. To further complicate matters, the clock
is embedded in the data and bit stuffing is used to ensure an
adequate number of edges for the receiving device to lock to
the clock. Even to the very trained eye, it would be extremely
difficult to quickly interpret the content of this message. Now
imagine this is a faulty message that only occurs once a day
and you need to trigger on it. Traditional oscilloscopes and
logic analyzers are simply not well equipped to deal with this
type of signal.
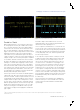
Even with a simpler serial standard such as I
2
C, it is still
significantly harder to observe what is being transmitted over
the bus than it is with a parallel protocol.
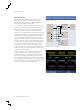
I
2
C uses separate clock and data lines, so at least in this case
you can use the clock as a reference point. However, you still
need to find the start of the message (data going low while the
clock is high), manually inspect and write down the data value
on every rising edge of the clock, and then organize the bits
into the message structure.
It can easily take a couple of minutes of work just to decode
a single message in a long acquisition and you have no idea
if that’s the message you are actually looking for. If it’s not,
then you need to start this tedious and error prone process
over on the next one. It would be nice to just trigger on the
message content you are looking for, however the state and
pattern triggers you’ve used for years on scopes and logic
analyzers won’t do you any good here. They are designed to
look at a pattern occurring at the same time across multiple
channels. To work on a serial bus, their trigger engines would
need to be tens to hundreds of states deep (one state per bit).
Even if this trigger capability existed, it would not be a fun task
programming it state-by-state for all these bits. There has to
be a better way!
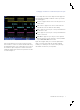
There is a better way. The following sections highlight how
Tektronix oscilloscopes
1
can be used with some of the most
common low-speed serial standards used in embedded
system design.
Figure 2. One message acquired from a CAN bus. Figure 3. One message acquired from an I
2
C bus.
1
Support for serial bus standards vary depending on the oscilloscope model. For a table of buses supported by different Tektronix oscilloscopes, please see Appendix A or
visit www.tektronix.com.