
User's Manual


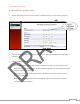
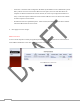
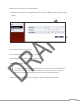


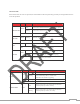
Table Of Contents
- Copyright
- Trademarks
- Document Information
- Product Overview
- Innovation at its Best
- Features at a Glance
- Hardware Specifications
- Documentation and software updates
- TABLE OF CONTENTS
- 1 Introduction
- 1.0 Contents / Accessories
- 2 TG590 Setup
- 2.0 Introduction
- 3 Setting Up a Wireless Network
- 3.0 Introduction
- 4 Configuring My Network Settings
- 4.0 Introduction
- 5 Using Network Connections
- 5.0 Introduction
- 6 Configuring Security
- 6.0 Introduction
- 7 Parental Controls
- 7.0 Introduction
- 8 Configuring Advanced Settings
- 8.0 Introduction
- 8.1 Using Advanced Settings
- 8.2 Utilities
- 8.3 DNS Settings
- 8.4 Network Settings
- 8.5 Configuration Settings
- 8.6 Time Settings
- 8.7 Firmware Upgrade (Future Release)
- 8.8 Routing Settings
- 9 Monitoring the TG590
- 9.0 Introduction
- 10 Troubleshooting
- 10.0 Introduction
- 1 INTRODUCTION
- In this chapter
- Feature availability
- 1 Getting Started
- Safety Instruction
- Please read “Safety Instructions and Regulatory Notices” before you start with the installation of the TG590.
- Applicability
- Note: The top panel where the LEDs are located also features an integral WPS button.
- Power Port:
- The Power port connects the TG590 Router to an electrical wall outlet via the Power cord.
- Power Switch:
- The Power switch powers the TG590 Router on and off.
- WAN Ethernet Port:
- The WAN Ethernet port connects the TG590 Router to the ISP using an Ethernet cable.
- In this chapter
- Feature availability
- (Listed in order from left to right)
- Reset Button
- Coax
- Power
- WAN Ethernet Port
- 2.2a Configuring Dynamic IP Addressing
- Windows Vista
- The TG590 is now configured.
- Note: The LED may be green from another set top. If so, check the set top instead.
- Broadband Connection
- Quick Links
- In this chapter
- Feature availability
- 3.1 Overview
- 3.2 Connecting a Wireless Client
- 3.3 Wireless Status
- 3.4 Basic Security Settings
- In this chapter
- Feature availability
- In this chapter
- Feature availability
- Using Network Connections
- Routing
- Additional IP Addresses
- Coax Link
- The only modifications that can be made from this screen are disabling the
- Note: If disabling the connection, the TG590 Router must be rebooted for the
- Properties window to generate the “Configure Broadband Connection
- Schedule Displays when the rule is active. To configure rules, see the “Advanced
- Network Select the type of connection being configured from the drop-down
- Connection Type Displays the type of connection. Since this is an Ethernet
- Physical Address Displays the physical address of the network card used for
- MTU MTU (Maximum Transmission Unit) specifies the largest packet size
- Internet Protocol
- No IP Address Select this option if the connection has no IP address. This is useful if the connection is operating under a bridge.
- Obtain an IP Address Automatically Select this option if the ISP requires the connection to obtain an IP address automatically. The server assigning the IP address also assigns a subnet mask address, which can be overridden by clicking in the “Overrid...
- Use the Following IP Address Select this option if the connection uses a permanent (static) IP address. The ISP should provide this address, along with a subnet mask address, default gateway address, and, optionally, primary and secondary DNS server a...
- DNS Server
- To configure the connection to automatically obtain a DNS server address, select Obtain DNS Server Address Automatically from the “DNS Server” drop-down list. To manually configure DNS server addresses, select Use the Following DNS Server Addresses. S...
- IP Address Distribution
- Disabled Select this option if statically assigning IP addresses to the network devices.
- Routing
- There are two options in the “Routing” section of the “Configure Broadband
- Routing Table
- Internet Connection Firewall
- Additional IP Addresses
- Routing
- Advanced
- To set up the TG590 Router’s Coax broadband connection for advanced routing:
- Internet Connection Firewall
- Additional IP Addresses
- Click WAN PPPoE in the Network Connections screen to generate the “WAN PPPoE Properties” screen. This screen displays a list of the connection’s properties. The only modifications that can be made from this screen are disabling the connection (by clic...
- Click Settings in the WAN PPPoE Properties screen to generate the “Configure WAN PPPoE” screen.
- Status Displays the connection status of the WAN PPPoE connection. (“Down,” “Disabled,” “Connected,” etc.)
- When should this rule occur? Displays when the rule is active. To schedule rules, see “Advanced Settings” chapter.
- Network Select the type of connection being configured from the drop-down list (Broadband Connection, Network (Home/Office), or DMZ).
- Connection Type Displays the type of connection. Since this is PPPoE connection, “PPPoE” is displayed.
- MTU MTU (Maximum Transmission Unit) specifies the largest packet size permitted for Internet transmission. “Automatic, sets the MTU at 1492. Other choices include “Automatic,” which sets the MTU according to the connection to the ISP, and “Manual,” wh...
- Underlying Connection Specify the underlying connection above which the protocol initiates from the drop-down list, which displays all possible underlying devices.
- Service Name Specify the networking peer’s service name, if provided by the ISP, in this text box.
- On-Demand To use PPP on demand to initiate the point-to-point protocol session only when packets are actually sent over the Internet, click in this check box. This option should be active on a limited basis Idle Time Before Hanging Up Enter the amount...
- Time Between Reconnect Attempts In this text box, specify the duration between PPP reconnect attempts, as provided by the ISP.
- PPP Authentication
- Warning! The PPP Authentication settings should not be changed unless instructed to do so by your ISP.
- Support Unencrypted Password (PAP) Password Authentication Protocol (PAP) is a simple, plain-text authentication scheme. The user name and password are requested by the networking peer in plain-text. PAP, however, is not a secure authentication protoc...
- Support Challenge Handshake Authentication (CHAP) Click in this check box to activate CHAP, a challenge-response authentication protocol that uses MD5 to hash the response to a challenge. CHAP protects against replay attacks by using an arbitrary chal...
- Support Microsoft CHAP Version 2 Select this check box if communicating with a peer that uses Microsoft CHAP Version 2 authentication protocol.
- PPP Compression
- For each compression algorithm (BSD and Deflate), select one of the following from the drop-down list:
- Reject Selecting this option rejects PPP connections with peers that use the compression algorithm. If Reject is activated, throughput may diminish.
- Allow Selecting this option allows PPP connections with peers that use the compression algorithm.
- Require Selecting this option insures a connection with a peer using the compression algorithm.
- Obtain an IP Address Automatically This option is selected by default. Change only if required by the ISP. The server that assigns the TG590 Router with an IP address also assigns a subnet mask. Override the dynamically assigned subnet mask by selecti...
- Use the Following IP Address Select this option to configure the TG590 to use a permanent (static) IP address. The ISP should provide this address.
- DNS Server
- To configure the connection to automatically obtain a DNS server address, select Obtain DNS Server Address Automatically from the “DNS Server” drop-down list. To manually configure DNS server addresses, select Use the Following DNS Server Addresses fr...
- Routing
- • Route - This option causes the TG590 Router to act as a router between two networks.
- • NAT - This option activates Network Address Translation (NAT), which translates IP addresses to a valid, public address on the Internet. NAT adds security, since the IP addresses of the devices on the network are not transmitted publicly. In addition, NA3
- Device Metric The device metric is a value used by the TG590 Router to
- Multicast - IGMP Proxy Default Click in this check box to enable the TG590 to issue IGMP (Internet Group Management Protocol) host messages on behalf of hosts the TG590 Router discovers through standard IGMP interfaces.
- IGMP proxy enables the routing of multicast packets according to the IGMP requests of local network devices asking to join multicast groups.
- In this chapter
- Feature availability
- Note: The “Allowed” section is only visible when the firewall is set to “Maximum.”
- 6.2 Port Forwarding
- 6.3 DMZ Host
- Note: to disable the DMZ Host, Click in the “DMZ Host IP Address” check box.
- 6.4 Port Triggering
- Accepted Outgoing Connections - activating this check box generates a log message for each successful attempt to establish an outgoing connection to the public network.
- All Blocked Connection Attempts - activating this check box generates log messages for all blocked events.
- In this chapter
- Feature availability
- Clicking Rule Summary from the menu on the left side generates the “Rule Summary” screen.
- Clicking Parental Control Log from the menu on the left side generates the “Parental Control Log” screen.
- In this chapter
- Feature availability
- 8.2 Utilities
- Note: To access the TG590’s GUI after restarting the TG590, click the web browser’s “Refresh” button, then log in using the
- Setting up Dynamic DNS
- Another Dynamic DNS screen appears.
- Note: Changing the redirection URL can only be performed via the Dynamic DNS provider’s website.
- SL Mode
- DNS Table
- Click Add DNS Entry in the DNS Server screen. The “DNS Entry” screen appears.
- 2. Enter the computer’s host name in the “Host Name” text box.
- 3. Enter the computer’s IP address in the “IP Address” text boxes.
- 4. Click Apply to save the changes.
- 8.4 Network Settings
- The Network Settings section of the Advanced screen includes settings that affect the TG590’s network.
- Specify a name for the network object in the “Description” text box.
- Click Add. The “Edit Item” screen appears.
- 6. Repeat to create other network objects, if needed. When finished, click Apply
- This section includes settings that affect the TG590’s configuration.
- Management Application SSL Authentication Options
- System Logging
- Enable Logging - Click in this check box to activate system logging.
- System Log Buffer Size - Enter the size of the system log buffer in this text box.
- Security Log Buffer Size - Enter the size of the security log buffer in this text box.
- Outgoing Mail Server
- Server - Enter the host name of the outgoing (SMTP) server in this text box.
- Port - Enter the port number of the email server in this text box.
- Enable Logging - Clicking in this check box activates automatic WAN detection.
- 8.6 Time Settings
- Note: Make sure the TG590 ’s date and time settings are properly configured for the time zone.
- IGMP (Internet Group Management Protocol) Multicasting
- Domain Routing
- Editing DHCP Server Settings
- DHCP Connections
- In this chapter
- Feature availability
- 9.1 Status
- 9.2 Advanced Status
- Check the LEDs
- Poor wireless connectivity
- Resetting your TG590
- Call the Help Desk

105
9 Troubleshooting
The TG590’s System Monitoring screens display important system information, including basic settings, system log,
key network device parameters and network traffic statistics.
9.1 Status
Click System Monitoring at the top of the Home screen to display the “ Status” screen, which displays the TG590’s
basic settings.
9.2 Advanced Status
After selecting Advanced Status and clicking Yes in the Warning screen, the monitoring options appear: System
Logging, Full Status/System wide Monitoring of Connections, Traffic Monitoring, and Broadband Monitoring.
9.2a System Logging
Click System Logging in the Advanced Status screen to generate the “System Log” screen. The System Log displays a
list of the most recent activities of the TG590.
9.2b Full Status/System wide Monitoring of Connections
1. Click Full Status/System wide Monitoring of Connections in the Advanced Status screen (and click through the
Warning screen) to generate the “Full Status/System wide Monitoring of Connections” screen, which features a
table summarizing the monitored connection data.
2. Click Refresh to update the table, or click Automatic Refresh On to constantly update the displayed parameters.
9.2c Traffic Monitoring
The TG590 constantly monitors traffic within the local network and between the local network and the Internet. To
view up-to-the-second statistical information about data received from and transmitted to the Internet, and about
data received from and transmitted to computers in the local network, click Traffic Monitoring in the Advanced Status
screen. This generates the “Traffic Monitoring” screen.
9.2d Bandwidth Monitoring
To monitor the TG590’s bandwidth use, click Bandwidth Monitoring. The “Bandwidth Monitor” screen appears.