
Instruction Manual

159
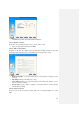
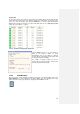
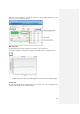
When the run has completed, results can be viewed in the Results Editor with data from each
stage of the run located under its own tab.
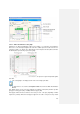
Multi-read graph
The graph displays the average readings for each well as colour-coded points.
If the multi-read graph is not displayed, simply click on the Multi-read icon to bring up the data:
•
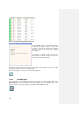
Clicking a well(s) in the plate layout will highlight the selected well on the multi-read graph.
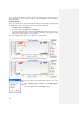
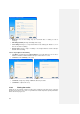
Results table
The data is displayed with the sample/well ID and an average of the selected readings in each
well. This value is plotted on the multi-read graph.