
Instruction Manual

143
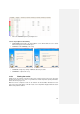
3.15.5 Quick guide to dissociation curve analysis
•
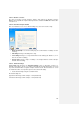
In the Experiment or Results Editor Analysis Selection box, highlight the stage on which
Dissociation Curve is to be performed and click
Edit
.
•
In the Analysis Wizard Selection box, choose
Dissociation curve
from the drop-down
menu and assign a use next to the appropriate dye name. Click
Next
.
•
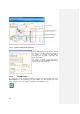
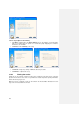
Background correction screen: Choose whether to smooth the data with a digital filter and
define where to position the cursors for correction. Click
Next
.
•
Peak Detection: Choose to detect peaks automatically or manually. Set the number of
peaks and threshold filter for automatic detection or the bin threshold and threshold filter for
manual detection. Click
Next
.
•
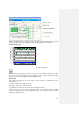
Peak area: Check the box to have peak area calculated from the data. Click
Next
.
•
Report options: Decide which data to display in the PrimeQ report. Click
Next
.
•
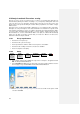
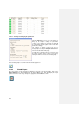
Summary of analysis. Click
Finish
to return to the Experiment or Results Editor main page.
•
The updated method appears in the Analysis Selection box in the Experiment or Results
Editor main screen.