
Overview of Primary Product

6.
Pipes, valves and fittings create resistance to flow or
friction head. Developing the data to plot a system curve
for a closed Hydronic system under pressure requires
calculation of the total of these friction head losses.
Friction tables are readily available that provide friction
loss data for pipe, valves and fittings. These tables
usually express the losses in terms of the equivalent length
of straight pipe of the same size as the valve or fitting.
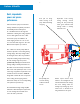
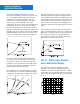
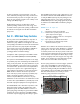
Once the total system friction is determined, a plot can be
made because this friction varies roughly as the square of the
liquid flow in the system. This plot represents the SYSTEM
CURVE. By laying the system curve over the pump perfor-
mance curve, the pump flow can be determined (Fig. 2–1).
Care must be taken that both pump head and friction
are expressed in feet and that both are plotted on the
same graph. The system curve will intersect the pump
performance curve at the flow rate of the pump because
this is the point at which the pump head is equal to the
required system head for the same flow.
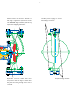
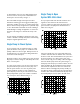
Fig. 2–2 illustrates the use of a discharge valve to change
the system head to vary pump flow. Partially closing the
valve shifts the operating point to a higher head or lower
flow capacity. Opening the valve has the opposite effect.
Working the system curve against the pump performance
curve for different total resistance possibilities provides the
system designer important information with which to make
pump and motor selection decisions for each system. A
system curve is also an effective tool in analyzing system
performance problems and choosing appropriate corrective
action.
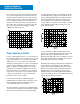
In an open Hydronic system, it may be necessary to add
head to raise the liquid from a lower level to a higher level.
Called static or elevation head, this amount is added to the
friction head to determine the total system head curve.
Fig. 2–3 illustrates a system curve developed by adding
static head to the friction head resistance.
Part III – Stable Curves, Unstable
Curves And Parallel Pumping
One of the ways in which the multitude of possible
performance curve shapes of centrifugal pumps can be
subdivided is as stable and unstable. The head of a stable
curve is highest at zero flow (shutoff) and decreases as the
flow increases. This is illustrated by the curve of Pump 2 in
Fig. 3 – 1.
1
Fig. 2-1
2
Fig. 2-2
Fig. 2-3
Commercial Hydronic
Application Information