
Overview of Primary Product


5.
Part I – Fundamentals
A centrifugal pump operated at constant speed delivers
any capacity from zero to maximum depending on the head,
design and suction conditions. Pump performance is most
commonly shown by means of plotted curves which are
graphical representations of a pump’s performance
characteristics. Pump curves present the average results
obtained from testing several pumps of the same design
under standardized test conditions. For a single family
residential application, considerations other than flow and
head are of relatively little economic or functional
importance, since the total load is small and the equipment
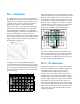
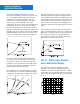
used is relatively standardized. For many smaller circulators,
only the flow and pressure produced are represented on
the performance curve (Fig. 1-1).
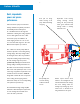
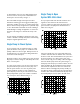
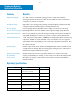
For larger and more complex buildings and systems,
economic and functional considerations are more critical,
and performance curves must relate the hydraulic efficiency,
the power required, the shaft speed, and the net positive
suction head required in addition to the flow and pressure
produced (Fig. 1-2).
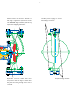
Pump performance curves show this interrelation of pump
head, flow and efficiency for a specific impeller diameter and
casing size. Since impellers of more than one diameter can
usually be fitted in a given pump casing, pump curves show
the performance of a given pump with impellers of various
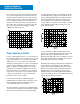
diameters. Often, a complete line of pumps of one design
is available and a plot called a composite or quick selection
curve can be used, to give a complete picture of the
available head and flow for a given pump line (Fig. 1-3).
Such charts normally give flow, head and pump size only,
and the specific performance curve must then be referred
to for impeller diameter, efficiency, and other details. For
most applications in our industry, pump curves are based
on clear water with a specific gravity of 1.0.
Part II – The System Curve
Understanding a system curve, sometimes called a system
head curve, is important because conditions in larger, more
complex piping systems vary as a result of either
controllable or uncontrollable changes. A pump can
operate at any point of rating on its performance curve,
depending on the actual total head of a particular system.
Partially closing a valve in the pump discharge or changing
the size or length of pipes are changes in system
conditions
that will alter the shape of a system curve and, in turn,
affect pump flow. Each pump model has a definite capacity
curve for a given impeller diameter and speed. Developing
a system curve provides the means to determine at what
point on that curve a pump will operate when used in a
particular piping system.
Fig. 1-1
10
20
10
JSA/MS 2-18-02 PC-2066 RevA ECN10627
CURVES BASED ON CLEAR WATER
WITH SPECIFIC GRAVITY OF 1.0
5.50"(140mm)
0
2H
P
3H
P
5H
P
5
7.5H
P
6.00"(152mm)
6.50"(165mm)
7.00"(178mm)
7.50"(191mm)
5 10 15
REQUIRED NPSH
2
0
8
4
6
Size 4 X 3 X 7.0
Min. Imp. Dia. 5.50"
Curve no. 2066
20 25 30 35
0
50
100
200
6
0
24
12
18
30
77%
75%
79%
77%
75%
65%
50%
55%
60%
70%
55%
50%
60%
65%
70%
(1.5KW)
(2.2KW)
(3.7KW)
(5.6KW
)
75
30
45
60
0
15
HEAD IN FEET
300
FLOW IN GALLONS PER MINUTE
150750 225 450375 525 600
Model 3007 1760 RPM
L/SEC
FI & CI Series
AUGUST 27, 2001
FEET
HEAD IN KILOPASCALS
HEAD IN METERS
KPa
NPSH
Fig. 1-2
Fig. 1-3