
Integration Guide
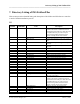
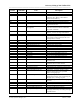
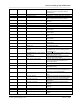
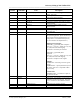
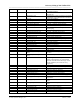
Table Of Contents
- I
- Introduction
- Architecture Overview
- Hardware Requirements
- PSS Software Installation
- Install NT 4.0 Server
- Install the NT 4 Service Pack
- Install Internet Explorer 4.01 Service Pack 2
- NT Option Pack Install
- Install the Video Driver
- Create and Format the Database partition
- Desktop Cleanup (optional)
- Install Microsoft SQL Server 7
- Create and Configure the PSS Database
- Install Microsoft Access
- Internet Explorer 5.0 with Task Scheduler install
- Install WaveWorks
- Install PSS Runtime System
- Install Waveworks Development Studio
- Install PSS Development System
- TFTP Configuration
- DHCP Configuration
- Create an ODBC Data Source
- Load Initial Data
- MS IIS Configuration
- Obtaining Access to PSS System Administration Screens
- Configure Task Scheduler
- Configure Unit Management
- Configure Licensing
- Configure the NBQMAIN Service (IBM 4690 POS Only)
- Setup NT System Log
- Configuration of the PSS System
- Validation of System Operation
- Directory Listing of PSS Folders/Files
- Software Description
- _
- Hardware Overview
- Software Components
- Database Access
- Start of Shopping Trip Processing
- Shopping Trip Processing
- End of Shopping Trip Processing
- Shopping Trip Message Log Entries
- Fatal Messages:
- PSSTransactionFile Processing
- POS Transaction File Processing
- Item Record File Processing
- Customer Update File Processing
- PSS Services
- _
- Customizing the PSS System Software
- Custom DisplayServer Scripts
- Custom Services
- Custom Business Objects
- User Exit DLL
- Available User Exit Functions
- UE_PreProcessItemFile
- UE_PreProcessItemRecord
- UE_PostProcessItemRecord
- UE_PostProcessItemFile
- UE_PreProcessTaxFile
- UE_PostProcessTaxFile
- UE_PreProcessPOSTransFile
- UE_PreProcessPOSTransRecord
- UE_PostProcessPOSTransRecord
- UE_ProcessEODRecord
- UE_PostProcessPOSTransFile
- UE_PreProcessPSSTransFile
- UE_PreProcessPSSTransRecord
- UE_PostProcessPSSTransFile
- UE_CalculateItemPrice_Method10to20
- UE_RescanLevelCalculation
- UE_Pre-RescanDetermination
- UE_PostRescanDetermination
- UE_PreProcessMarketingMessage
- UE_LoginAuthorization
- System Administration Interface
- Specific Features

Validation of System Operation
______________________________________________________________________________
WaveWorks PSS, Integration Guide, 1.10 Page 58
© 2000, Symbol Technologies, Inc. February 1, 2000
6.2 Obtaining System Status Information
6.2.1 Viewing The System Log
The System Log screen allows you to view detailed information on events that have occurred in
the system; for example, to determine the cause when the system is down.
From the Main Menu, select System / Settings / Status / System Log.
This screen displays the following information:
• The dates and times that events occurred. The pages are ordered from the most current
event to the least current.
• The facility (part of the software) that performs a function. Examples are Unit
Management, Transaction Ticket, PSS File Processor, etc.
• Actions performed that are specifically related to the facility, such as Terminal Returned,
Print Receipt / Stub, POS transFile, etc.
• Severity code from 1-4 and 10, in ascending order of severity.
• Messages.
This System Log screen has several filter options for limiting the data display as follows:
• Display all events in a particular date / time range.
• Display all events associated with a particular facility within a date / time range.
• Display all events associated with a particular action and date / time range.
• Display all events with a particular severity code and date / time range.
• Display all events with messages containing typed-in words or phrases.
• You can also display data with all of the above filter options or select a date / range and
any other one or more of these options.
Note: The data in the log can be limited or expanded by setting the “trace level” of a particular
system facility (function) to a particular level. Trace levels are set in the PSS Settings screen. If
the trace level for the Quick Order function is set to 2, for example, the system will save
information at level 2 and above, but will not save errors to the log that are beneath that level.
The lower the trace level, the more details on the function are saved in the log.
Trace levels are displayed on the log under the title Severity Level. If problems occur with a
facility of the system, you can view the severity level for that facility and decide to lower the
trace level so that future events relating to that facility will be saved in the log.