
User Manual Part 3
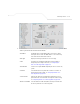
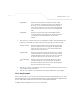
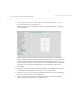
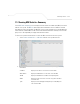
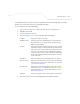
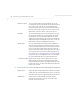
Table Of Contents

Monitoring Statistics
7-21
5. Refer to the Errors field to reference retry information as well as data transmissions the
target access point 802.11a or 802.11 b/g radio either gave up on could not decrypt.
6. Click the Clear Radio Stats button to reset each of the data collection counters to zero in
order to begin new data collections.
7. Click the Logout button to securely exit the access point Symbol Access Point applet.
7.4.1.1 Retry Histogram
Refer to the Retry Histrogram screen for an overview of the retries transmitted by an access point
radio and whether those retries contained any data packets. Use this information in combination with
the error fields within a Radio Stats screen to assess overall radio performance.
To display a Retry Histogram screen for an access point radio:
Avg MU Noise Displays the average RF noise for all MUs associated with the
access point radio. The number in black represents MU noise for
the last 30 seconds and the number in blue represents MU noise
for the last hour. If MU noise is excessive, consider moving the MU
closer to the
access point, or in area with less conflicting network
traffic.
Avg MU SNR Displays the average Signal to Noise Ratio (SNR) for all MUs
associated with the
access point radio. The Signal to Noise Ratio
is an indication of overall RF performance on your wireless
network.
Avg Num. of Retries Displays the average number of retries for all MUs associated with
the
access point 802.11a or 802.11b/g radio. The number in black
represents retries for the last 30 seconds and the number in blue
represents retries for the last hour.
Dropped Packets Displays the percentage of packets the AP gave up on for all MUs
associated with the
access point 802.11a or 802.11b/g radio. The
number in black represents this statistic for the last 30 seconds and
the number in blue represents this statistic for the last hour.
% of Undecryptable
Pkts
Displays the percentage of undecryptable packets for all MUs
associated with the 802.11a or 802.11b/g radio. The number in
black represents packets for the last 30 seconds and the number in
blue represents packets for the last hour.