
Specifications


OLE objects and the OLE presentation style
494 InfoMaker
3 If necessary, change the order of columns by dragging them up or down
within the Target Data box.
The order of the columns and expressions is important to the OLE server.
You need to know how the server will use the data to choose the order.
4 Double-click an item in the Target Data box to specify an expression
instead of a column.
In the Modify Expression dialog box, you can edit the expression or use
the Functions or Columns boxes and the operator buttons to select
elements of the expression. For example, you may want to specify an
aggregation function for a column. Use the range
for object if you use
an aggregation function; for example,
sum (salary for object).
For more information about using operators, expressions, and functions,
see Part 6, “Reference.”
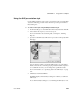
Example of a completed Data property page This example of the Data
property page specifies two columns to transfer to Microsoft Graph:
city and
salary. Graph expects the first column to be the categories and the second
column to be the data values. The second column is an aggregate so that the
graph will show the sum of all salaries in each city:
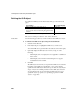
Specifying a value for
Rows
The last setting on the Data property page specifies how the OLE object is
associated with rows in the report. The selection (all rows, current row, or page)
usually corresponds with the band where you placed the OLE object, as
explained in this table. If you used the OLE presentation style to create the
report, this setting does not display on the property page: the OLE object is
always associated with all the rows in the report.