
Specifications


CHAPTER 17 Using OLE in a Report
Users Guide 493
The way the OLE object uses the data depends on the server. For example, data
transferred to Microsoft Excel is displayed as a spreadsheet. Data transferred
to Microsoft Graph populates its datasheet, which becomes the data being
graphed.
Some ActiveX controls do not display data, so you would not transfer any data
to them.
Group By and Target
Data boxes
Two boxes on the Data property page list data columns or expressions:
• Group By Specifies how InfoMaker groups the data it transfers to the
OLE object. Aggregation functions in the target data expressions use the
groupings specified here.
•Target DataSpecifies the data that you want to transfer to the OLE
object.
Populating the Group
By and Target Data
boxes
If you are using the OLE presentation style, you populated the Group By and
Target Data boxes when you created the report. If you placed an OLE object in
an existing report, the boxes are empty. You use the browse buttons next to the
Group By and Target Data boxes to open dialog boxes where you can select the
data you want to use or modify your selections.
Modifying source data
You cannot modify the source data for the report on the Data property page.
Select Design>Data Source from the menu bar if you need to modify the data
source.
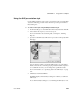
❖ To select or modify how data will be grouped in the OLE object:
1 Click the Browse button next to the Group By box.
2 In the Modify Group By dialog box, drag one or more columns from the
Source Data box to the Group By box.
You can rearrange columns and specify an expression instead of the
column name if you need to. For more information, see the next procedure.
❖ To select or modify which data columns display in the OLE object:
1 Click the Browse button next to the Target Data box.
2 In the Modify Target Data dialog box, drag one or more columns from the
Source Data box to the Target Data box.
The same source column can appear in both the Group By and Target Data
box.