User's Manual
Manuals
Brands
Suzhou EAVision Robotic Technologies Manuals
Electronics
Intelligent Multi-rotor Plant Protection UAV
51
52
53
54
55
56
57
58
59
60
51
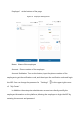
Figure 40
Mapping th
e Calibration Points
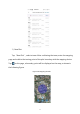
Enter the plot in the list, such as
“巴西”
. Enter the
“
Plot Detail
”
of
“巴西”
,
as shown in the figure below.
Figure 41
Plot Detail
1
...
...
53
54
55
56
57
...
...
67