
Operation Manual
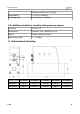
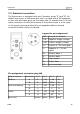


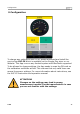


Table Of Contents
- 1 Safety instructions
- 2 RF Exposure Information and Statement
- 3 Application
- 4 Features
- 5 Technical Data
- 6 Dimensional drawing
- 7 Installation
- 8 Sensor signal outputs
- 9 Configuration
- 10 Data logging
- 11 Calibration
- 12 Disposal or waste
- 13 12 Warranty
- 14 Appendix A Specifications
- 15 Appendix B Modbus communication example
- 16 Appendix C LRC and CRC calculation

Data logging
10 Data logging
The S 418 provides the data logger function to help you record and
analyze data measured over time.
10.1 Features
Before you use the data logger, learn about how it works:
• You can use the Android App S4C-FS to enable or disable the data
logger function and set a sampling rate as needed.
• By default the data logger is disabled. Once you enable the data
logger, the S 418 starts logging data. Once you disable the data
logger, the S 418 stops logging.
• The S 418 saves all sampled data records into one file. Each
record includes a time stamp and all measurement data sampled
at this time point, such as flow, consumption, pressure and
temperature.
• The S 418 log file supports up to 5.6 million records due to its
memory size, which is equivalent to 64-day data at the one-
second sampling rate.
• When the S 418 runs out of memory, the new record will replace
the oldest one.
• To read out the logs recorded in the S 418 memory, install S4A
(1.1.2 or later versions), which is a specialized log analysis
software from SUTO, on a Windows-based computer. Also, connect
the PC with the S 418 through the USB port.
• Although data records are saved in one file in the S 418, S4A
reads them out into multiple log files in the following situations:
• When the sampling rate is changed, S4A reads out the data
records into a different file.
• When the S 418 stops logging (for example, poweroff) and
resumes in less than 24 hours, S4A still reads out the data
records into one file; However, if the time gap is larger than
24 hours, S4A reads out the new data records to a different
file.
• S4A enables you to have a graphic view on measurement data
recorded in a log file.
18 S 418