
Data Sheet

Package and PCB thermal data VNH3SP30-E
28/33
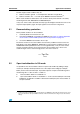
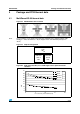
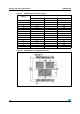
Figure 43. Thermal fitting model of an H-bridge in MultiPowerSO-30
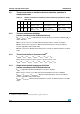
Table 15. Thermal parameters
(1)
1. The blank space means that the value is the same as the previous one.
Area/island (cm
2
)Footprint4 8 16
R1 = R7 (°C/W) 0.05
R2 = R8 (°C/W) 0.3
R3 (°C/W) 0.5
R4 (°C/W) 1.3
R5 (°C/W) 14
R6 (°C/W) 44.7 39.1 31.6 23.7
R9 = R10= R15= R16 (°C/W) 0.6
R11 = R17 (°C/W) 0.8
R12 = R18 (°C/W) 1.5
R13 = R19 (°C/W) 20
R14 = R20 (°C/W) 46.9 36.1 30.4 20.8
R21 = R22 = R23 (°C/W) 115
C1 = C7 = C9 = C15 (W.s/°C) 0.001
C2 = C8 (W.s/°C) 0.005
C3 = (W.s/°C) 0.02
C4 = C13 = C19 (W.s/°C) 0.3
C5 (W.s/°C) 0.6
C6 (W.s/°C) 5 7 9 11
C10 = C11= C16 = C17 (W.s/°C) 0.003
C12 = C18 (W.s/°C) 0.075
C14 = C20 (W.s/°C) 2.5 3.5 4.5 5.5