
User's Manual


PC-IP Software
User’s Manual
76
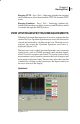
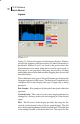
Figure 5-12 shows the typical recalled Upstream Spectrum
display. Markers provide the frequency indication and level
where the marker is positioned. Markers 1, 2 and 3 are fixed to
the points where the measurements were made when the test
results were saved. A blue cursor is also provided, which may be
moved by clicking and holding down on the button while
dragging the cursor to the desired location.
The technician name, type of file and file name are displayed in
the upper right area of the screen. The display will automatically
configure itself to best display the type of signal that is being
measured
Bar Graphs – Bar graphs are displayed of the signal within the
spectrum.
Vertical Scale - The vertical scale is auto ranging and may be
changed by clicking on the scale and dragging it to the desired
range.
Plot - The Plot area of the display provides the range for the
vertical and horizontal scale of the bar graph display. The left
box is the beginning channel of the horizontal axis. The right box
is the ending channel on the horizontal axis. The top box is the
maximum level displayed on the vertical axis and the lower box
is the minimum level displayed on the vertical axis. The user
may change the settings by clicking on the desired box and
entering the new data.
Zoom Box – Clicking on the Zoom Box button, as shown in the
Figure 5-12, allows the user to place a box over the area of the
bar graph that he wishes to view.
To place the Zoom Box, place the cursor over the upper left most
area of the bar graph to be viewed and hold down the mouse
button while dragging the box to the lower right most area to be
included in the view and release the mouse button.
Auto Range – Clicking the Auto Range button automatically
scales the Scan bar graph to best display the measurement
results.
Zoom Out – Clicking the Zoom Out button automatically
zooms out to the maximum vertical and horizontal scale.