
User's Manual

PC-IP Software
User’s Manual
50
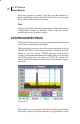
at M2 and is displayed next to the M2 marker. Calculations are
then made to calculate C/I that is the difference in level between
the APL of the TDMA signal and the RMS of peak of the
interfering signal (M2 set on ingress or distortion). A calculation
is also made to determine the C/N that is the difference between
the TDMA signal level and the noise measurement at M3 (which
is compensated for the specified bandwidth). Thus, the C/I ratio
is the difference between the APL of the TDMA upstream signal
and the RMS of the peak of the interfering signal. C/N is the
difference between the APL of the TDMA signal and the
average power of the noise in the same bandwidth.
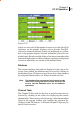
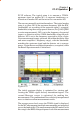
In instances where the user is not viewing the upstream path with
return signals, but looking at the drop for ingress, the Ingress
Scan screen provides a spectral view of the upstream frequency
range with measurements for both narrow band and noise like
(broadband) ingress. In this screen, only Marker 2 and Marker
3 are used, to view the Ingress measurement using M2 and the
Noise level using M3. The Install Profiler also allows the
administrator to set a maximum limit for each type of ingress and
displays the margin between the limit and the current
measurement. Similar to the Upstream Spectrum screen, the
markers may be moved and the Measurement function used to
make measurements of any ingress viewed on the display.
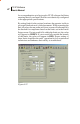
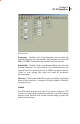
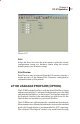
Upstream Marker Setup
To set up the three markers for the Upstream Spectrum option,
click on the Upstream Spectrum icon. This will open a window
displaying the setup criteria for each marker. The Frequency,
Bandwidth and Detector type for each marker is displayed.