
Datasheet
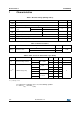
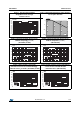
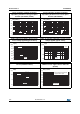
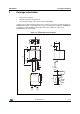
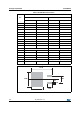
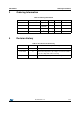
Table Of Contents
- Table 1. Device summary
- 1 Characteristics
- Table 2. Absolute ratings (limiting values)
- Table 3. Thermal resistance
- Table 4. Static electrical characteristics (per diode)
- Figure 1. Average forward power dissipation versus average forward current
- Figure 2. Normalized avalanche power derating versus pulse duration
- Figure 3. Average forward current versus ambient temperature, d = 0.5, (TO-220AC, D2PAK)
- Figure 4. Average forward current versus ambient temperature, d = 0.5, (TO-220FPAC)
- Figure 5. Non repetitive surge peak forward current versus overload duration - maximum values, per diode (TO-220AC, D2PAK)
- Figure 6. Non repetitive surge peak forward current versus overload duration - maximum values (TO-220FPAC)
- Figure 7. Relative variation of thermal impedance junction to case versus pulse duration (TO-220AC, D2PAK)
- Figure 8. Relative variation of thermal impedance junction to case versus pulse duration (TO-220FPAC)
- Figure 9. Reverse leakage current versus reverse voltage applied (typical values)
- Figure 10. Junction capacitance versus reverse voltage applied (typical values)
- Figure 11. Forward voltage drop versus forward current (maximum values)
- Figure 12. Thermal resistance junction to ambient versus copper surface under tab (D²PAK)
- 2 Package Information
- 3 Ordering Information
- 4 Revision history
Package Information STPS8H100
6/10 DocID5387 Rev 11
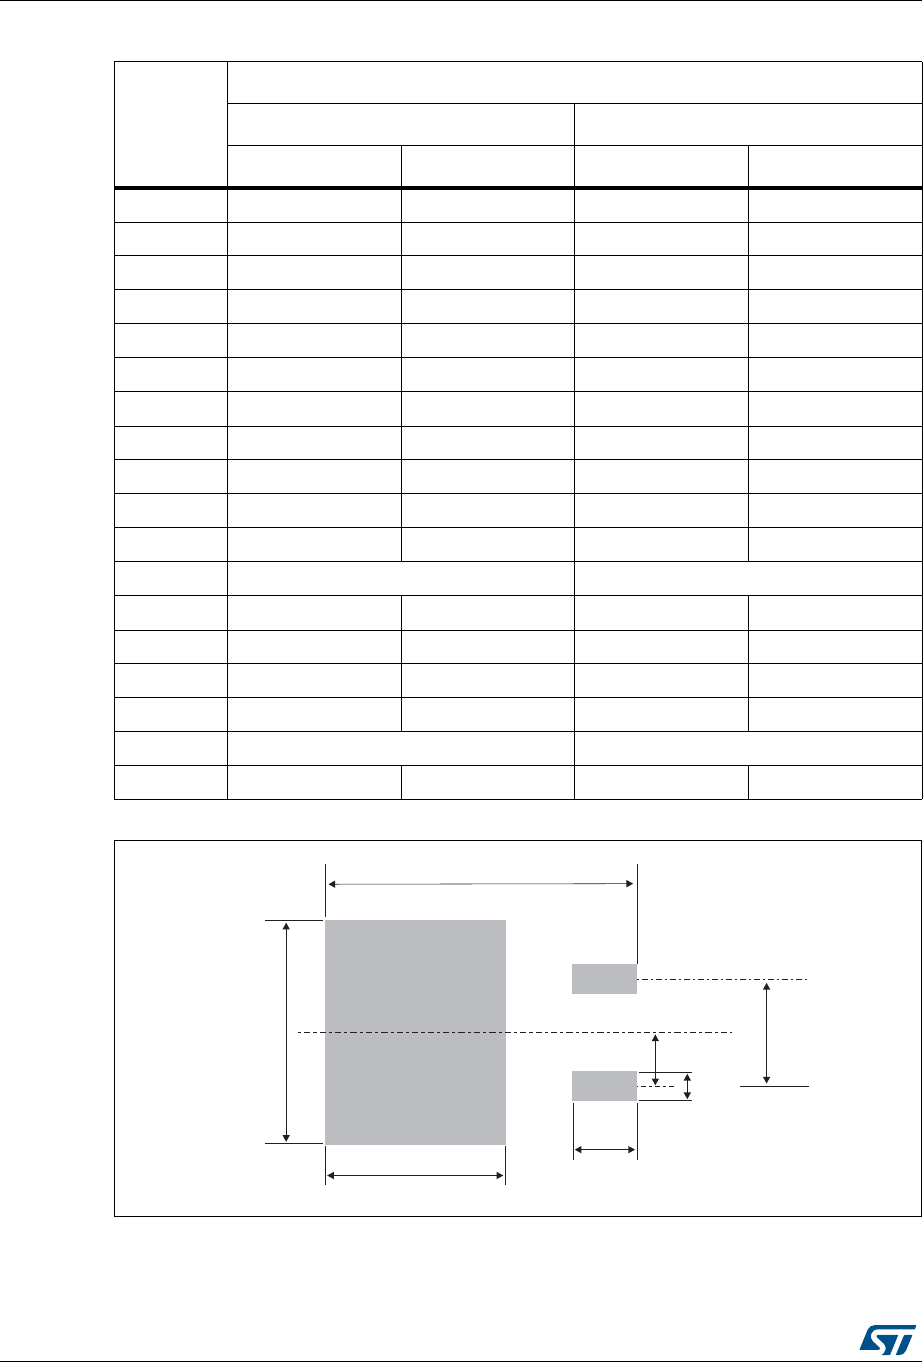
Figure 14. D
2
PAK footprint dimensions (in mm)
Table 5. D
2
PAK dimension values
Ref.
Dimensions
Millimeters Inches
Min. Max. Min. Max.
A 4.36 4.60 0.172 0.181
A1 0.00 0.25 0.000 0.010
b 0.70 0.93 0.028 0.037
b2 1.14 1.70 0.045 0.067
c 0.38 0.694 0.015 0.027
c1 0.38 0.534 0.015 0.021
c2 1.19 1.36 0.047 0.053
D 8.60 9.35 0.339 0.368
D1 6.90 - 0.272 -
E 10.00 10.55 0.394 0.415
E1 8.10 - 0.319 -
e 2.54 typ. 0.100 typ.
H 15.00 15.85 0.591 0.624
L 1.90 2.79 0.075 0.110
L1 - 1.65 - 0.065
L2 - 1.78 - 0.070
L3 0.25 typ. 0.010 typ.
L4 4.78 5.28 0.188 0.208
16.90
12.20
9.75
3.50
5.08
1.60
2.54