
Datasheet
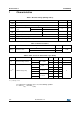
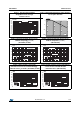

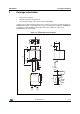
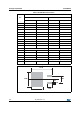
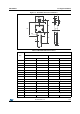
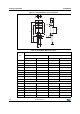
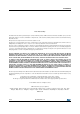
Table Of Contents
- Table 1. Device summary
- 1 Characteristics
- Table 2. Absolute ratings (limiting values)
- Table 3. Thermal resistance
- Table 4. Static electrical characteristics (per diode)
- Figure 1. Average forward power dissipation versus average forward current
- Figure 2. Normalized avalanche power derating versus pulse duration
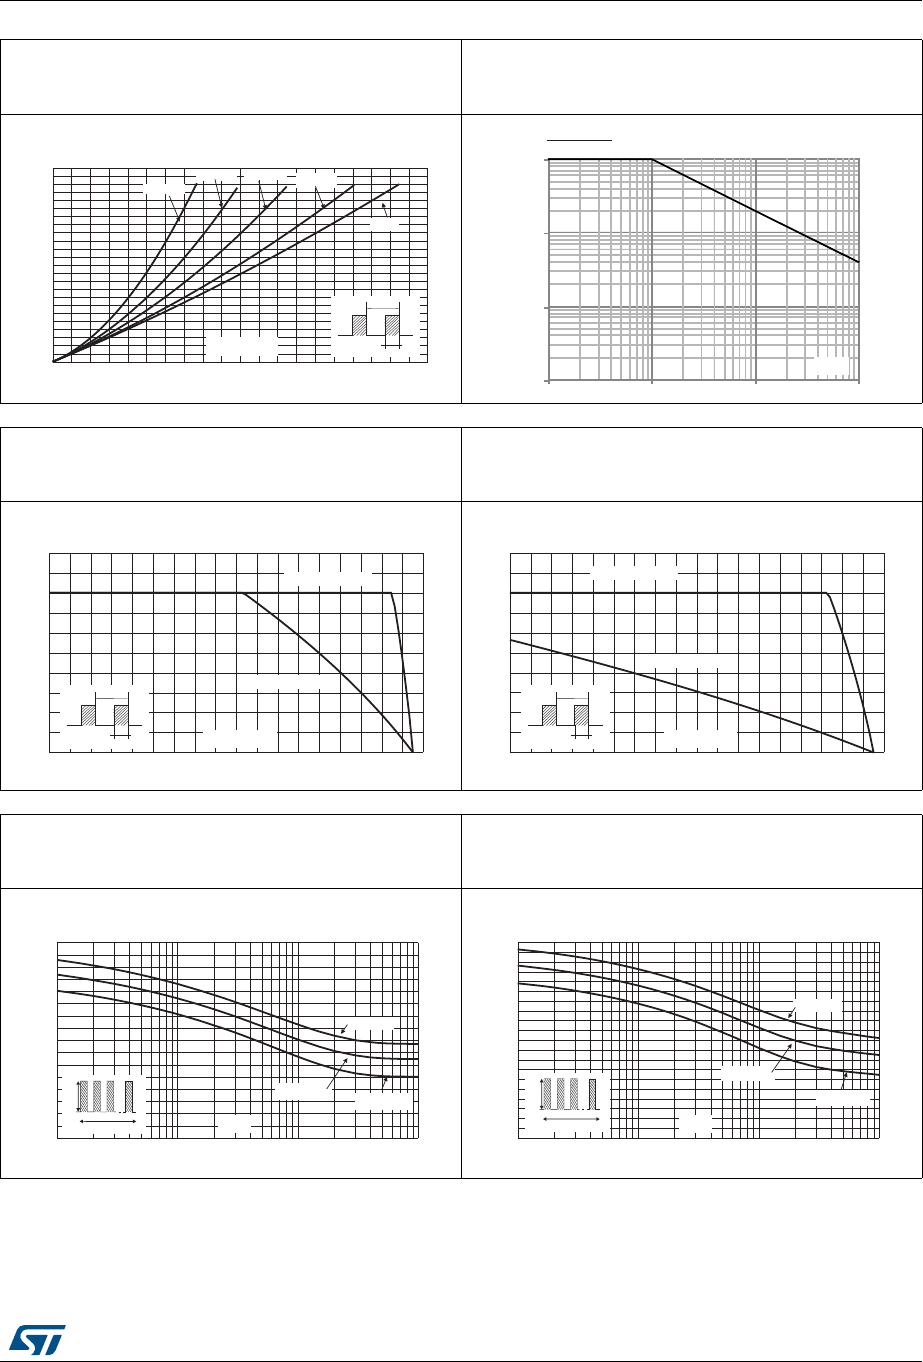
- Figure 3. Average forward current versus ambient temperature, d = 0.5, (TO-220AC, D2PAK)
- Figure 4. Average forward current versus ambient temperature, d = 0.5, (TO-220FPAC)
- Figure 5. Non repetitive surge peak forward current versus overload duration - maximum values, per diode (TO-220AC, D2PAK)
- Figure 6. Non repetitive surge peak forward current versus overload duration - maximum values (TO-220FPAC)
- Figure 7. Relative variation of thermal impedance junction to case versus pulse duration (TO-220AC, D2PAK)
- Figure 8. Relative variation of thermal impedance junction to case versus pulse duration (TO-220FPAC)
- Figure 9. Reverse leakage current versus reverse voltage applied (typical values)
- Figure 10. Junction capacitance versus reverse voltage applied (typical values)
- Figure 11. Forward voltage drop versus forward current (maximum values)
- Figure 12. Thermal resistance junction to ambient versus copper surface under tab (D²PAK)
- 2 Package Information
- 3 Ordering Information
- 4 Revision history
DocID5387 Rev 11 3/10
STPS8H100 Characteristics
10
Figure 1. Average forward power
dissipation versus average
forward current
Figure 2. Normalized avalanche power derating
versus pulse duration
012345678910
0.0
0.5
1.0
1.5
2.0
2.5
3.0
3.5
4.0
4.5
5.0
5.5
6.0
I (A)
F(av)
P(W)
F(av)
δ = 0.2
δ = 0.5
δ = 1
δ = 0.05
δ = 0.1
T
δ
=t
p
/T=t
p
/T
t
p
t
p
P(t
p
)
P (10 µs)
ARM
ARM
0.001
0.01
0.1
1
1
10 100 1000
t
(µs)
p
Figure 3. Average forward current versus
ambient temperature, δ = 0.5,
(TO-220AC, D
2
PAK)
Figure 4. Average forward current versus
ambient temperature, δ = 0.5,
(TO-220FPAC)
0 20 40 60 80 100 120 140 160 180
0
2
4
6
8
10
T
amb
(°C)
I
F(av)
(A)
R
th(j-a)
=15°C/W
R
th(j-a)
=R
th(j-c)
T
δ
=t
p
/T=t
p
/T
t
p
t
p
0 20 40 60 80 100 120 140 160 180
0
2
4
6
8
10
R
th(j-a)
=50°C/W
R
th(j-a)
=R
th(j-c)
T
amb
(°C)
I
F(av)
(A)
T
δ
=t
p
/T=t
p
/T
t
p
t
p
Figure 5. Non repetitive surge peak
forward current versus overload duration -
maximum values, per diode (TO-220AC, D
2
PAK)
Figure 6. Non repetitive surge peak forward
current versus overload duration
- maximum values (TO-220FPAC)
1E-3 1E-2 1E-1 1E+0
0
20
40
60
80
100
120
140
160
t(s)
I
M
(A)
T
c
=75°C
T
c
=100°C
T
c
=125°C
IM
t
δ=0.5
1E-3 1E-2 1E-1 1E+0
0
10
20
30
40
50
60
70
80
90
100
T
c
=75°C
T
c
=100°C
T
c
=125°C
t(s)
I
M
(A)
IM
t
δ=0.5