
User manual


DocID026171 Rev 6 25/79
VL6180X Functional description
78
the current consumption scales accordingly i.e. the average current consumption at 1 Hz
under the same conditions would be 0.17 mA.
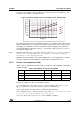
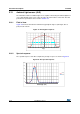
Figure 14. Typical ranging current consumption (10 Hz sampling rate)
The minimum average current consumption in Figure 14. is 1.5 mA, 0.5 mA of which comes
from pre-calibration before each measurement and 1.0 mA from post-processing (readout
averaging). Pre-calibration is a fixed overhead but readout averaging can be reduced or
effectively disabled by setting the READOUT__AVERAGING_SAMPLE_PERIOD{0x10A} to
zero (default setting is 48).
Note: Decreasing the READOUT__AVERAGING_SAMPLE_PERIOD will increase sampling
noise. It is recommended that any change in setting be properly
evaluated in the end application.
Minimum current consumption scales with sampling rate i.e. at a sampling rate of 1 Hz the
current consumption associated with pre- and post-processing will be 0.15 μA.
2.11.2 Current consumption calculator
Table 11. gives a breakdown of typical current consumption for pre-calibration, ranging and
readout averaging.
Current consumption can then be calculated as follows:
I (
μA) = sampling_rate * [Q
1
+ (Q
2
* RESULT__RANGE_RETURN_CONV_TIME in ms) +
Q
3
* (1.3 + (READOUT__AVERAGING_SAMPLE_PERIOD * 0.0645 ms))]
Table 7. gives typical convergence times for different target reflectance.
So, for example, RESULT__RANGE_RETURN_CONV_TIME for a 3% target at 50 mm
is 4.35 ms. At 10 Hz sampling rate this gives:
I (
μA) = 10 * [41.6 + (22 * 4.35) + 25 * (1.3 + (48 * 0.0645))] = 2472 μA
Ϭ͘ϬϬ
Ϭ͘ϱϬ
ϭ͘ϬϬ
ϭ͘ϱϬ
Ϯ͘ϬϬ
Ϯ͘ϱϬ
ϯ͘ϬϬ
ϯ͘ϱϬ
ϰ͘ϬϬ
ϰ͘ϱϬ
Ϭ ϭϬϮϬϯϬϰϬϱϬϲϬϳϬϴϬϵϬϭϬϬ
ƵƌƌĞŶƚĐŽŶƐƵŵƉƚŝŽŶ;ŵͿ
ZĂŶŐĞ;ŵŵͿ
ϯй
ϱй
ϭϳй
ϴϴй
Table 11. Breakdown of current consumption
Label Phase I (mA) t (ms) Q (μC) = I x t
Q
1
Pre-calibration 13.0 3.2 41.6
Q
2
Ranging 22.0 per ms 22.0 per ms
Q
3
Readout averaging 25.0 per ms 25.0 per ms