
User manual
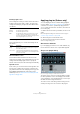
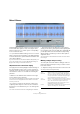
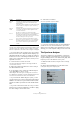
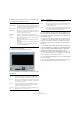
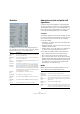
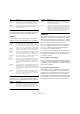
Table Of Contents
- Table of Contents
- Part I: Getting into the details
- About this manual
- Setting up your system
- VST Connections
- The Project window
- Working with projects
- Creating new projects
- Opening projects
- Closing projects
- Saving projects
- The Archive and Backup functions
- Startup Options
- The Project Setup dialog
- Zoom and view options
- Audio handling
- Auditioning audio parts and events
- Scrubbing audio
- Editing parts and events
- Range editing
- Region operations
- The Edit History dialog
- The Preferences dialog
- Working with tracks and lanes
- Playback and the Transport panel
- Recording
- Quantizing MIDI and audio
- Fades, crossfades and envelopes
- The arranger track
- The transpose functions
- Using markers
- The Mixer
- Control Room (Cubase only)
- Audio effects
- VST instruments and instrument tracks
- Surround sound (Cubase only)
- Automation
- Audio processing and functions
- The Sample Editor
- The Audio Part Editor
- The Pool
- The MediaBay
- Introduction
- Working with the MediaBay
- The Define Locations section
- The Locations section
- The Results list
- Previewing files
- The Filters section
- The Attribute Inspector
- The Loop Browser, Sound Browser, and Mini Browser windows
- Preferences
- Key commands
- Working with MediaBay-related windows
- Working with Volume databases
- Working with track presets
- Track Quick Controls
- Remote controlling Cubase
- MIDI realtime parameters and effects
- Using MIDI devices
- MIDI processing
- The MIDI editors
- Introduction
- Opening a MIDI editor
- The Key Editor – Overview
- Key Editor operations
- The In-Place Editor
- The Drum Editor – Overview
- Drum Editor operations
- Working with drum maps
- Using drum name lists
- The List Editor – Overview
- List Editor operations
- Working with SysEx messages
- Recording SysEx parameter changes
- Editing SysEx messages
- The basic Score Editor – Overview
- Score Editor operations
- Expression maps (Cubase only)
- Note Expression (Cubase only)
- The Logical Editor, Transformer, and Input Transformer
- The Project Logical Editor (Cubase only)
- Editing tempo and signature
- The Project Browser (Cubase only)
- Export Audio Mixdown
- Synchronization
- Video
- ReWire
- File handling
- Customizing
- Key commands
- Part II: Score layout and printing (Cubase only)
- How the Score Editor works
- The basics
- About this chapter
- Preparations
- Opening the Score Editor
- The project cursor
- Playing back and recording
- Page Mode
- Changing the zoom factor
- The active staff
- Making page setup settings
- Designing your work space
- About the Score Editor context menus
- About dialogs in the Score Editor
- Setting clef, key, and time signature
- Transposing instruments
- Printing from the Score Editor
- Exporting pages as image files
- Working order
- Force update
- Transcribing MIDI recordings
- Entering and editing notes
- About this chapter
- Score settings
- Note values and positions
- Adding and editing notes
- Selecting notes
- Moving notes
- Duplicating notes
- Cut, copy, and paste
- Editing pitches of individual notes
- Changing the length of notes
- Splitting a note in two
- Working with the Display Quantize tool
- Split (piano) staves
- Strategies: Multiple staves
- Inserting and editing clefs, keys, or time signatures
- Deleting notes
- Staff settings
- Polyphonic voicing
- About this chapter
- Background: Polyphonic voicing
- Setting up the voices
- Strategies: How many voices do I need?
- Entering notes into voices
- Checking which voice a note belongs to
- Moving notes between voices
- Handling rests
- Voices and Display Quantize
- Creating crossed voicings
- Automatic polyphonic voicing – Merge All Staves
- Converting voices to tracks – Extract Voices
- Additional note and rest formatting
- Working with symbols
- Working with chords
- Working with text
- Working with layouts
- Working with MusicXML
- Designing your score: additional techniques
- Scoring for drums
- Creating tablature
- The score and MIDI playback
- Tips and Tricks
- Index

258
Audio processing and functions
The default values give good results in most situations, but
you can adjust the settings if you like:
3. Click the Process button.
The spectrum is computed and displayed as a graph.
4. You can adjust the display with the settings in the dis-
play window:
5. If you move the mouse pointer over the graph, a cross-
hair cursor follows the graph curve and the display in the
upper right corner shows the frequency/note and level at
the current position.
To compare the level between two frequencies, move the pointer to one
of the frequencies, right-click once and move the pointer to the second
frequency. The delta value (the difference in level between the current
position and the right-click position) is displayed in the upper right corner
(labeled “D”).
• If you analyze stereo audio and selected the “Stereo” op-
tion in the first dialog, the graphs for the left and right chan-
nel are superimposed in the display, with the left channel
graph in white and the right channel graph in yellow.
The display in the upper right corner shows the values for the left channel
– to see the right channel values, hold down [Shift]. An “L” or “R” is dis
-
played to indicate which channel values are shown.
6. You can leave the window open or close it by clicking
the “Close” button.
If you leave it open and the “Active” checkbox is ticked, the result of the
next Spectrum Analysis will be displayed in the same window.
Option Description
Size in Samples The function divides the audio into “analysis blocks”, the
size of which is set here. The larger this value, the higher
the frequency resolution of the resulting spectrum.
Size of Overlap The overlap between each analysis block.
Window used Allows you to select which window type is used for the
FFT (Fast Fourier Transform, the mathematical method
used for computing the spectrum).
Normalized
Values
When this is activated, the resulting level values are
scaled, so that the highest level is displayed as “1” (0
dB).
From Stereo When analyzing stereo material, there is a pop-up menu
with the following options:
Mono mix – the stereo signal is mixed to mono before
analyzing.
Mono left/right – the left or right channel signal is used
for analysis.
Stereo – both channels are analyzed (two separate
spectrums will be displayed).
Setting Description
dB When this is activated, the vertical axis shows dB values.
When it is deactivated, values between 0 and 1 are shown.
Freq. log When this is activated, frequencies (on the horizontal axis)
are displayed on a logarithmic scale. When it is deactivated,
the frequency axis is linear.
Precision Indicates the frequency resolution of the graph. This value
cannot be changed here, but is governed by the Size in
Samples setting in the previous dialog.
Frequency/
Note
Allows you to select whether you want the frequencies to be
displayed in Hertz or with note names.
Min. Sets the lowest frequency shown in the graph.
Max. Sets the highest frequency shown in the graph. By adjusting
the Min and Max values, you can take a closer look at a
smaller frequency range.
Active When this is activated, the next Spectrum Analysis will appear
in the same window. When deactivated, new Spectrum Anal
-
ysis results will appear in separate windows.
Setting Description