
User manual
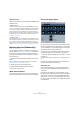
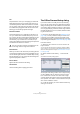
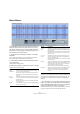
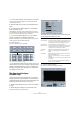
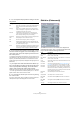

Table Of Contents
- Table of Contents
- Part I: Getting into the details
- About this manual
- VST Connections: Setting up input and output busses
- The Project window
- Playback and the Transport panel
- Recording
- Fades, crossfades and envelopes
- The Arranger track
- The Transpose functions
- The mixer
- Control Room (Cubase only)
- Audio effects
- VST Instruments and Instrument tracks
- Surround sound (Cubase only)
- Automation
- Audio processing and functions
- The Sample Editor
- The Audio Part Editor
- The Pool
- The MediaBay
- Working with Track Presets
- Track Quick Controls
- Remote controlling Cubase
- MIDI realtime parameters and effects
- Using MIDI devices
- MIDI processing and quantizing
- The MIDI editors
- Introduction
- Opening a MIDI editor
- The Key Editor - Overview
- Key Editor operations
- The In-Place Editor
- The Drum Editor - Overview
- Drum Editor operations
- Working with drum maps
- Using drum name lists
- The List Editor - Overview
- List Editor operations
- Working with System Exclusive messages
- Recording System Exclusive parameter changes
- Editing System Exclusive messages
- VST Expression
- The Logical Editor, Transformer and Input Transformer
- The Project Logical Editor
- Editing tempo and signature
- The Project Browser
- Export Audio Mixdown
- Synchronization
- Video
- ReWire
- File handling
- Customizing
- Key commands
- Part II: Score layout and printing
- How the Score Editor works
- The basics
- About this chapter
- Preparations
- Opening the Score Editor
- The project cursor
- Playing back and recording
- Page Mode
- Changing the Zoom factor
- The active staff
- Making page setup settings
- Designing your work space
- About the Score Editor context menus
- About dialogs in the Score Editor
- Setting key, clef and time signature
- Transposing instruments
- Printing from the Score Editor
- Exporting pages as image files
- Working order
- Force update
- Transcribing MIDI recordings
- Entering and editing notes
- About this chapter
- Score settings
- Note values and positions
- Adding and editing notes
- Selecting notes
- Moving notes
- Duplicating notes
- Cut, copy and paste
- Editing pitches of individual notes
- Changing the length of notes
- Splitting a note in two
- Working with the Display Quantize tool
- Split (piano) staves
- Strategies: Multiple staves
- Inserting and editing clefs, keys or time signatures
- Deleting notes
- Staff settings
- Polyphonic voicing
- About this chapter
- Background: Polyphonic voicing
- Setting up the voices
- Strategies: How many voices do I need?
- Entering notes into voices
- Checking which voice a note belongs to
- Moving notes between voices
- Handling rests
- Voices and Display Quantize
- Creating crossed voicings
- Automatic polyphonic voicing - Merge All Staves
- Converting voices to tracks - Extract Voices
- Additional note and rest formatting
- Working with symbols
- Working with chords
- Working with text
- Working with layouts
- Working with MusicXML
- Designing your score: additional techniques
- Scoring for drums
- Creating tablature
- The score and MIDI playback
- Tips and Tricks
- Index

218
Audio processing and functions
4. You can adjust the display with the settings in the dis-
play window:
5. If you move the mouse pointer over the graph, a cross-
hair cursor follows the graph curve and the display in the
upper right corner shows the frequency/note and level at
the current position.
To compare the level between two frequencies, move the pointer to one
of the frequencies, right-click once and move the pointer to the second
frequency. The delta value (the difference in level between the current
position and the right-click position) is displayed in the upper right corner
(labeled “D”).
• If you analyze stereo audio and selected the “Stereo” op-
tion in the first dialog, the graphs for the left and right chan-
nel are superimposed in the display, with the left channel
graph in white and the right channel graph in yellow.
The display in the upper right corner shows the values for the left channel
– to see the right channel values, hold down [Shift]. An “L” or “R” is dis-
played to indicate which channel values are shown.
6. You can leave the window open or close it by clicking
the “Close” button.
If you leave it open and the “Active” checkbox is ticked, the result of the
next Spectrum Analysis will be displayed in the same window.
Statistics (Cubase only)
The Statistics function on the Audio menu analyzes the
selected audio (events, clips or range selections) and dis-
plays a window with the following information:
Setting Description
dB When this is activated, the vertical axis shows dB values.
When it is deactivated, values between 0 and 1 are
shown.
Freq. log When this is activated, frequencies (on the horizontal
axis) are displayed on a logarithmic scale. When it is de-
activated, the frequency axis is linear.
Precision Indicates the frequency resolution of the graph. This
value cannot be changed here, but is governed by the
Size in Samples setting in the previous dialog.
Frequency/
Note
Allows you to select whether you want the frequencies to
be displayed in Hertz or with note names.
Min. Sets the lowest frequency shown in the graph.
Max. Sets the highest frequency shown in the graph. By ad-
justing the Min and Max values, you can take a closer look
at a smaller frequency range.
Active When this is activated, the next Spectrum Analysis will ap-
pear in the same window. When deactivated, new Spec-
trum Analysis results will appear in separate windows.
Item Description
Min. Sample
Value
The lowest sample value in the selection, as a value be-
tween -1 and 1 and in dB.
Max. Sample
Value
The highest sample value in the selection, as a value be-
tween -1 and 1 and in dB.
Peak
Amplitude
The largest sample value (in absolute numbers) in the se-
lection, in dB.
DC Offset The amount of DC Offset (see “Remove DC Offset” on
page 211) in the selection, as a percentage and in dB.
Estimated
Resolution
Even though an audio file is in 16 or 24 bits, it may have
been converted from a lower resolution. The Estimated
Resolution value makes an educated guess about the ac-
tual audio resolution, by computing the smallest level dif-
ference between two samples.
Estimated
Pitch
The estimated pitch of the audio selection.
Sample Rate The sample rate of the audio selection.
Min. RMS
Power
The lowest loudness (RMS) measured in the selection.
Max. RMS
Power
The highest loudness (RMS) measured in the selection.
Average The average loudness over the whole selection.