
User manual
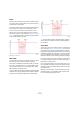
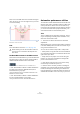
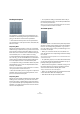

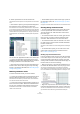
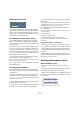
Table Of Contents
- Table of Contents
- Part I: Getting into the details
- About this manual
- VST Connections: Setting up input and output busses
- The Project window
- Playback and the Transport panel
- Recording
- Fades, crossfades and envelopes
- The Arranger track
- The Transpose functions
- The mixer
- Control Room (Cubase only)
- Audio effects
- VST Instruments and Instrument tracks
- Surround sound (Cubase only)
- Automation
- Audio processing and functions
- The Sample Editor
- The Audio Part Editor
- The Pool
- The MediaBay
- Working with Track Presets
- Track Quick Controls
- Remote controlling Cubase
- MIDI realtime parameters and effects
- Using MIDI devices
- MIDI processing and quantizing
- The MIDI editors
- Introduction
- Opening a MIDI editor
- The Key Editor - Overview
- Key Editor operations
- The In-Place Editor
- The Drum Editor - Overview
- Drum Editor operations
- Working with drum maps
- Using drum name lists
- The List Editor - Overview
- List Editor operations
- Working with System Exclusive messages
- Recording System Exclusive parameter changes
- Editing System Exclusive messages
- VST Expression
- The Logical Editor, Transformer and Input Transformer
- The Project Logical Editor
- Editing tempo and signature
- The Project Browser
- Export Audio Mixdown
- Synchronization
- Video
- ReWire
- File handling
- Customizing
- Key commands
- Part II: Score layout and printing
- How the Score Editor works
- The basics
- About this chapter
- Preparations
- Opening the Score Editor
- The project cursor
- Playing back and recording
- Page Mode
- Changing the Zoom factor
- The active staff
- Making page setup settings
- Designing your work space
- About the Score Editor context menus
- About dialogs in the Score Editor
- Setting key, clef and time signature
- Transposing instruments
- Printing from the Score Editor
- Exporting pages as image files
- Working order
- Force update
- Transcribing MIDI recordings
- Entering and editing notes
- About this chapter
- Score settings
- Note values and positions
- Adding and editing notes
- Selecting notes
- Moving notes
- Duplicating notes
- Cut, copy and paste
- Editing pitches of individual notes
- Changing the length of notes
- Splitting a note in two
- Working with the Display Quantize tool
- Split (piano) staves
- Strategies: Multiple staves
- Inserting and editing clefs, keys or time signatures
- Deleting notes
- Staff settings
- Polyphonic voicing
- About this chapter
- Background: Polyphonic voicing
- Setting up the voices
- Strategies: How many voices do I need?
- Entering notes into voices
- Checking which voice a note belongs to
- Moving notes between voices
- Handling rests
- Voices and Display Quantize
- Creating crossed voicings
- Automatic polyphonic voicing - Merge All Staves
- Converting voices to tracks - Extract Voices
- Additional note and rest formatting
- Working with symbols
- Working with chords
- Working with text
- Working with layouts
- Working with MusicXML
- Designing your score: additional techniques
- Scoring for drums
- Creating tablature
- The score and MIDI playback
- Tips and Tricks
- Index

200
Automation
About the static value line
When you open an automation track for a parameter for the
first time, it does not contain any automation events (unless
you have previously adjusted that parameter with write au-
tomation activated), and this is reflected in the event display
as a straight horizontal black line, the “static value” line. This
line represents the current parameter setting.
• If you have manually added any automation events or
used write automation for the corresponding parameter,
and then disable the reading of automation data, the auto-
mation curve will be grayed-out in the automation track
event display and the static value will be used instead.
As soon as Read mode is enabled, the automation curve will become
available.
Editing automation events
Drawing automation events
By using write automation in the mixer, you generate auto-
mation events by moving parameter encoders and faders
in the mixer. You can also add them manually by drawing
automation curves on an automation track. Proceed as
follows:
1. Open an automation track for the track you want to
make settings for.
The static value line is shown in the event display for the automation track
and the Volume parameter is selected.
2. Select the Pencil tool.
You can also use the various modes of the Line tool for drawing curves,
see below.
3. Click on the static value line. An automation event is
added, read automation mode is automatically activated,
and the static value line changes to a blue automation
curve.
4. If you click and hold, you can draw a curve by adding a
multitude of single automation events.
Note that the track color in the Track list changes to red to indicate that
automation data is being written.
5. When you release the mouse button, the number of
automation events is reduced to a few events, but the ba-
sic shape of the curve still remains the same.
This “thinning out” of events is governed by the Reduction Level setting
in the Settings section of the Automation panel, see “Reduction Level”
on page 195.
6. If you now activate playback, the volume will change
with the automation curve.
In the mixer, the corresponding fader moves accordingly.
7. Simply redo the operation if you are not happy with the
result.
If you draw over existing events, a new curve is created.
• If the automation track is in Read mode already, you can
also add automation events by clicking with the Arrow
tool.
If you are trying to add a break-point between two existing points and the
new point does not deviate from the existing curve, it will be removed by
reduction as soon as you release the mouse button (see “Reduction
Level” on page 195).
Using the various modes of the Line tool to draw
automation curves
The Line tool can be very useful for drawing automation
events. The various modes are accessed by selecting the
Line tool on the toolbar, clicking on it a second time and
selecting from the pop-up menu that appears.
• Clicking and dragging with the Line tool in Line mode
shows a line in the automation track and creates automa-
tion events aligned with this line.
This is a quick way to create linear fades, etc.