
User Manual


191
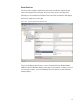
Statistics Monitor
The Statistics Monitor is a powerful tool that displays a real-time, color coded
overview of system performance. When you set up your new system, and want
to monitor ongoing system performance, you will use the Statistics Monitor.
This tool appears similar to the Configurator, displaying the Segment Tree for the
segment you select on the left of the screen, and the hardware categories on the
right. To check the performance of the entire system, select the segment at the
top of the tree. Reader statistics display at the top of the screen and Portal statis-
tics display at the bottom.
You can access the Statistics Monitor from the Applications menu at the top of
the Configurator Main Screen or launch it from the Windows Start menu as a
separate application
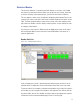
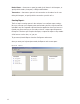
Reader Statistics
Figure 138 Viewing Reader Statistics
In this example, the system is performing well, delivering transactions at an ac-
ceptable level. To display the actual measurement, hover the cursor over a bar.
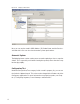
To get more detail; for example, to diagnose the problem of low signal for a partic-
ular reader, you can navigate to that reader in the Segment Tree and see data for
only that reader. You can also double-click the reader on the right panel. Specific
information for the selected reader displays in the list on the right.