
Datasheet


Table Of Contents
- 1 Characteristics
- Table 1. Absolute maximum ratings
- Table 2. Electrical characteristics (Tj = 25 C, unless otherwise specified)
- Table 3. Static characteristics
- Table 4. Thermal resistances
- Figure 1. Maximum power dissipation versus on-state rms current (full cycle)
- Figure 2. On-state rms current versus lead (TO-92) or tab (SOT-223, SMBflat- 3L) temperature (full cycle)
- Figure 3. On-state rms current versus ambient temperature (free air convection full cycle)
- Figure 4. Relative variation of thermal impedance versus pulse duration (Zth(j-a))
- Figure 5. Relative variation of holding current and latching current versus junction temperature (typ. values)
- Figure 6. Relative variation of gate trigger current (IGT) and voltage (VGT) versus junction temperature
- Figure 7. Surge peak on-state current versus number of cycles
- Figure 8. Non-repetitive surge peak on-state current and corresponding value of I2t sinusoidal pulse width
- Figure 9. On-state characteristics (maximum values) (ITM = f(VTM)
- Figure 10. Relative variation of critical rate of decrease of main current versus (dV/dt)c
- Figure 11. Relative variation of critical rate of decrease of main current (dI/dt) versus junction temperature
- Figure 12. SOT-223 and SMBflat-3L thermal resistance junction to ambient versus copper surface under case
- Figure 13. Relative variation of static dV/dt immunity versus junction temperature (gate open)
- 2 Ordering information scheme
- 3 Packaging information
- 4 Ordering information
- 5 Revision history
Z01 Characteristics
Doc ID 7474 Rev 10 5/12
Figure 13. Relative variation of static dV/dt immunity versus junction temperature (gate open)
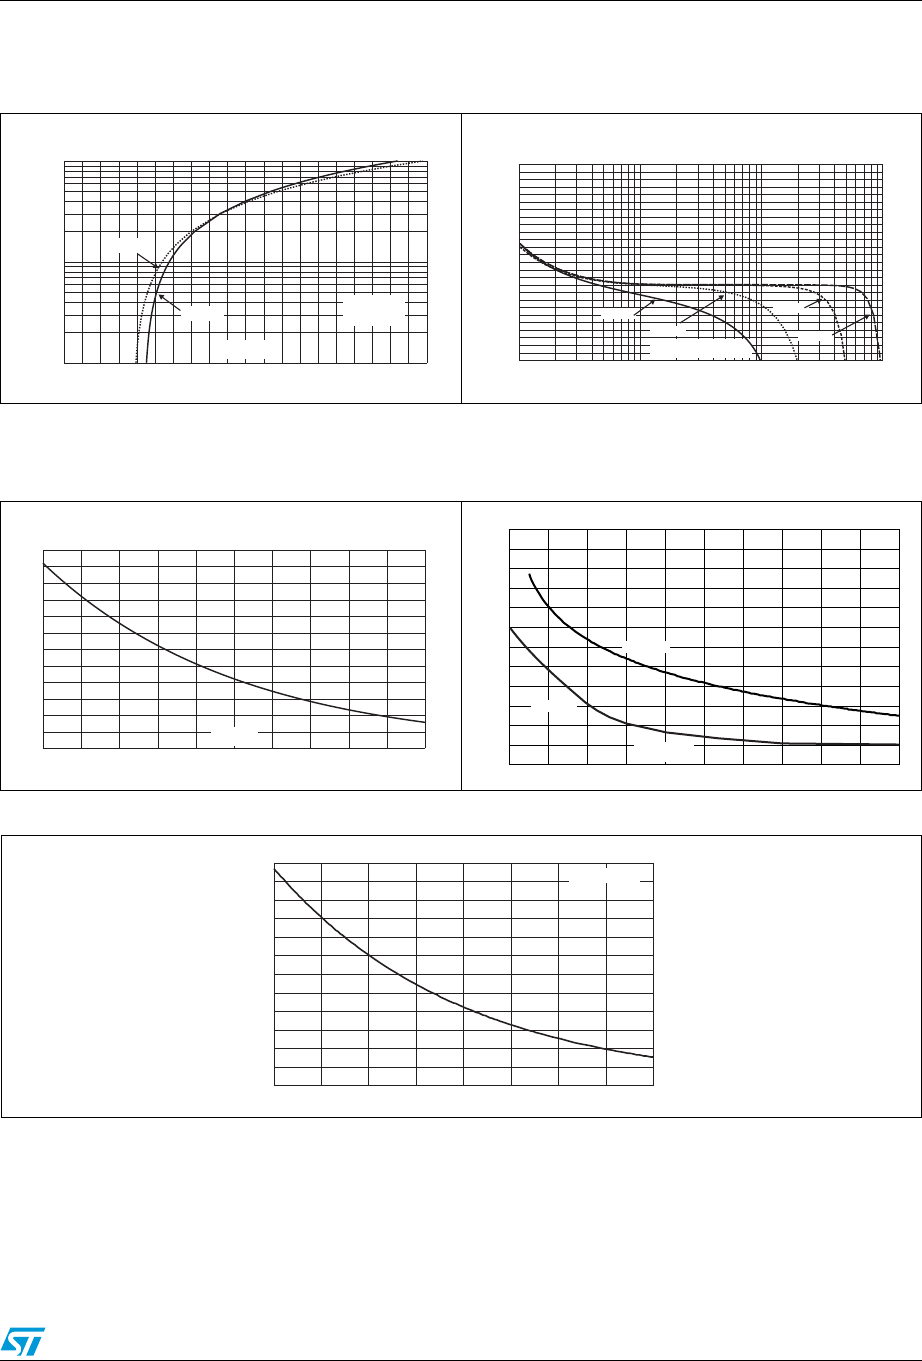
Figure 9. On-state characteristics
(maximum values) (I
TM
= f(V
TM
)
Figure 10. Relative variation of critical rate
of decrease of main current versus
(dV/dt)
c
I (A)
TM
0.0 0.5 1.0 1.5 2.0 2.5 3.0 3.5 4.0 4.5 5.0
0.1
1.0
10.0
V (V)
TM
T = max.
j
T
j
T = 25°C
j
T =max.
j
V =0.95 V
R =400 m
t0
d
Ω
0.1 1.0 10.0 100.0
0.0
0.2
0.4
0.6
0.8
1.0
1.2
1.4
1.6
1.8
2.0
2.2
2.4
2.6
Z0103
Z0107
Z0110
Z0109
(dI/dt)c [(dV/dt)c] / Specified (dI/dt)c
(dV/dt)c (V/µs)
Figure 11. Relative variation of critical rate of
decrease of main current (dI/dt)
versus junction temperature
Figure 12. SOT-223 and SMBflat-3L thermal
resistance junction to ambient
versus copper surface under case
0 25 50 75 100 125
0
1
2
3
4
5
6
(dI/dt)c [T ] / Specified]
j
(dI/dt)c [T
j
T (°C)
j
50
60
70
80
90
100
110
120
130
140
SOT223
150
160
170
0
12
3
4
5
R (°C/W)
th(j-a)
S(cm²)
CU
SMBF3L
0
1
2
3
4
5
6
25 50 75 100 125
T
j
(°C)
dV/dt [T
j
]/dV/dt[T
j
=125 °C]
V
D
=V
R
=402V