
Datasheet

Characteristics STPS8H100
4/9
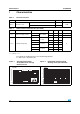
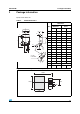
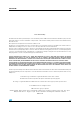
Figure 9. Relative variation of thermal
impedance junction to case versus
pulse duration (TO-220FPAC)
Figure 10. Reverse leakage current versus
reverse voltage applied (typical
values)
1E-3 1E-2 1E-1 1E+0 1E+1
0.0
0.2
0.4
0.6
0.8
1.0
t
p
(s)
Z
th(j-c)
/R
th(j-c)
δ = 0.1
δ = 0.2
δ = 0.5
Single pulse
T
δ
=t
p
/T
=t
p
/T
t
p
t
p
0 102030405060708090100
1E-2
1E-1
1E+0
1E+1
1E+2
1E+3
5E+3
V
R
(V)
I
R
(µA)
T
j
=125°C
T
j
=25°C
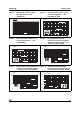
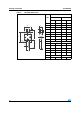
Figure 11. Junction capacitance versus
reverse voltage applied (typical
values)
Figure 12. Forward voltage drop versus
forward current (maximum values)
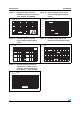
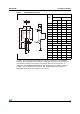
Figure 13. Thermal resistance junction to
ambient versus copper surface
under tab - Epoxy printed circuit
board FR4, e
cu
= 35 µm (D
2
PAK)
1 10 100
100
200
500
1000
V
R
(V)
C(pF)
F=1MHz
T
j
=25°C
0 0.2 0.4 0.6 0.8 1 1.2 1.4 1.6
0.1
1.0
10.0
50.0
V
FM
(V)
I
FM
(A)
T
j
=25°C
T
j
=125°C
0 4 8 12 16 20 24 28 32 36 40
0
10
20
30
40
50
60
70
80
S
(Cu)
(cm²)
R
th(j-a)
(°C/W)