
Datasheet

Characteristics STPS2L30
4/10
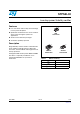
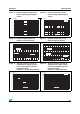
Figure 7. Non repetitive surge peak forward
current versus overload duration
(maximum values) SMA flat
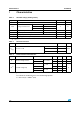
Figure 8. Normalized avalanche power
derating versus pulse duration
I (A)
M
0
1
2
3
4
5
6
7
8
1.E-03 1.E-02 1.E-01 1.E+00
T
a
=25 °C
T
a
=75 °C
T
a
=125 °C
I
M
t
δ =0.5
SMA-Flat
t(s)
0.001
0.01
0.10.01 1
0.1
10 100 1000
1
t (µs)
p
P(t)
P (1µs)
ARM p
ARM
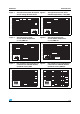
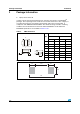
Figure 9. Normalized avalanche power
derating versus junction
temperature
Figure 10. Relative variation of thermal
impedance, junction to ambient,
versus pulse duration - SMA
0
0.2
0.4
0.6
0.8
1
1.2
25 50 75 100 125 150
T (°C)
j
P(T)
P (25°C)
ARM
j
ARM
0.0
0.1
0.2
0.3
0.4
0.5
0.6
0.7
0.8
0.9
1.0
1.E-02 1.E-01 1.E+00 1.E+01 1.E+02 1.E+03
Z/R
th(j-a) th(j-a)
T
δ
=tp/T
tp
t (s)
p
Single pulse
SMA
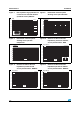
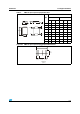
Figure 11. Relative variation of thermal
impedance junction to lead
versus pulse duration - SMB flat
Figure 12. Relative variation of thermal
impedance junction to ambient
versus pulse duration - SMA flat
0.0
0.1
0.2
0.3
0.4
0.5
0.6
0.7
0.8
0.9
1.0
1.E-04 1.E-03 1.E-02 1.E-01 1.E+00 1.E+01
Z/R
th(j-l) th(j-l)
SMB flat
t (s)
p
Single pulse
Z/R
th(j-a) th(j-a)
0.0
0.1
0.2
0.3
0.4
0.5
0.6
0.7
0.8
0.9
1.0
1.E-02 1.E-01 1.E+00 1.E+01 1.E+02 1.E+03
Single pulse
SMA-Flat
t (s)
p